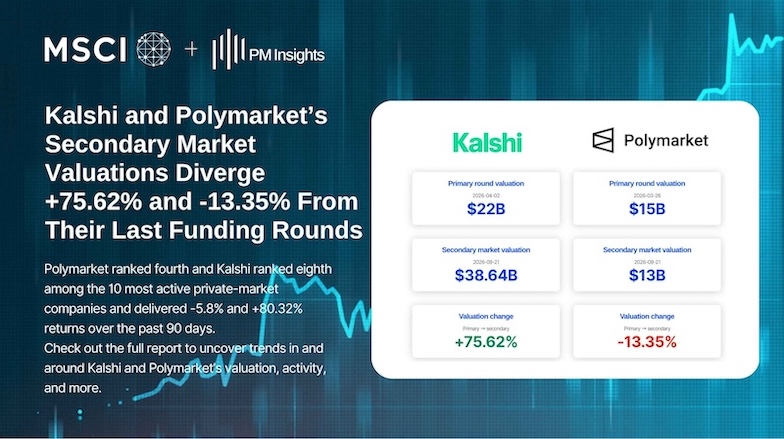
Kalshi and Polymarket’s Secondary Market Valuations Diverge +75.62% and -13.35% From Their Last Funding Rounds
Weekly Edition & Stock Spotlight
September 22, 2026
This report examines the business performance, competitive positioning and market activity of Kalshi and Polymarket within the prediction markets sector. Both companies operate platforms where participants can trade contracts tied to the outcomes of future events across areas such as politics, sports and economics.
The report assesses their business models, trading activity, market offerings, regulatory frameworks, funding and corporate development using publicly available information and MSCI Private Company Insights data.
Key takeaways
- 90-day stock performance: Polymarket ranked fourth and Kalshi ranked eighth among the 10 most active private-market companies and delivered -5.8% and +80.32% returns over the past 90 days.
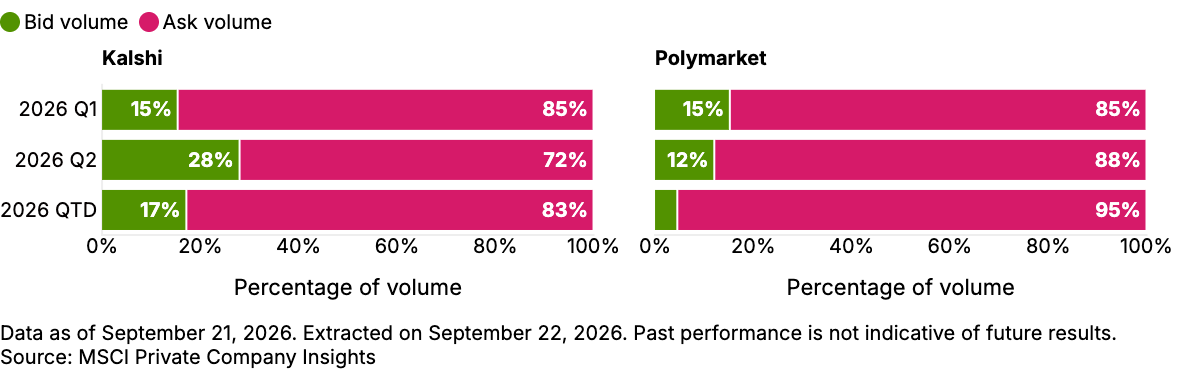
- Largest bid-side volume in 2026: Kalshi recorded its highest bid-side volume in QTD 2026 at $586.1 million, representing 17% of total volume, while Polymarket recorded its highest in Q1 2026 at $182.5 million, representing 15% of total volume.
- Largest ask-side volume in 2026: Kalshi recorded its highest ask-side volume in QTD 2026 at $2.83 billion, representing 83% of total volume, while Polymarket recorded its highest in QTD 2026 at $1.52 billion, also representing 95% of total volume.
Before examining Kalshi and Polymarket in detail, the report first provides a broader view of the private growth market through the year-to-date performance of the PM50 Growth versus selected public market indexes and the performance of the 10 most active private companies across sectors. This context helps frame the market environment in which Polymarket and Kalshi has traded.
Data as of September 21, 2026. Past performance, whether actual, backtested or simulated, is no indication or guarantee of future performance. Source: MSCI Private Company Insights secondary market data. Unless otherwise stated, all analysis and statistics in this report are derived from MSCI Private Company Insights observations of secondary market activity and all amounts are in U.S. dollars (USD).
MSCI Private Company Insights (f.k.a. PM Insights) provides independent, market-driven data for private growth and pre-IPO companies, delivering transparency and helping asset managers, banks, consultants, investors and regulators understand trading conditions and risk in this dynamic market.

PM50 Growth vs. selected public indexes year to date
%20PM50%20Growth%20vs%20Public%20Sectors%20ROI%402x.png)
The PM50 Growth tracks the performance of the 50 most active private names observed in the secondary market. It is an equal-weighted aggregation, rebalanced on a monthly basis.
This rebalancing of constituents over time gives way for more active names to participate in what we observe as "market performance," and in a more appropriate manner than static selections and weightings criteria.
Most active names performance across all sectors
%20Top%20Ten%20Movers%402x%20(4).png)
Kalshi and Polymarket operate prediction market platforms that allow users to trade contracts tied to the outcomes of real-world events. The two companies have followed different regulatory paths in the U.S. market.
Platform comparison
<row>
<col>
</col>
<col>

</col>
<col>
.png)
</col>
</row>
<row>
<col>Founded</col>
<col>2018</col>
<col>2020</col>
</row>
<row>
<col>Founder(s)</col>
<col>Tarek Mansour & Luana Lopes Lara</col>
<col>Shayne Coplan</col>
</row>
<row>
<col>Origins</col>
<col>U.S.-regulated event-contract exchange</col>
<col>Crypto-native prediction market</col>
</row>
<row>
<col>Core Product</col>
<col>Binary Yes/No event contracts</col>
<col>Binary Yes/No event contracts</col>
</row>
<row>
<col>Revenue Model</col>
<col>Transaction fees</col>
<col>Evolving transaction-fee model</col>
</row>
<row>
<col>Fee Structure</col>
<col>Primarily taker fees; makers generally fee-free</col>
<col>Historically fee-free; taker fees introduced in 2026</col>
</row>
<row>
<col>Contract Mechanics</col>
<col>$0–$1 contract price → $1 payout if correct</col>
<col>$0–$1 share price → $1 payout if correct</col>
</row>
<row>
<col>Infrastructure</col>
<col>Centralized, regulated exchange</col>
<col>Polygon/USDC internationally; regulated U.S. exchange</col>
</row>
<row>
<col>U.S. Regulatory Path</col>
<col>Commodity Futures Trading Commission (CFTC)-designated Designated Contract Market (DCM) since 2020</col>
<col>2022 CFTC action → 2025 regulated U.S. re-entry</col>
</row>
Scale and growth
<row>
<col> </col>
<col>
</col>
<col>
</col>
</row>
<row>
<col>Trading Volume Trend</col>
<col>$226M (Dec 2024) → $6.6B (Dec 2025) → $29.2B monthly (June 2026)</col>
<col>$73M (2023) → ~$9B (2024) → $10.5B monthly peak (Mar 2026) → $8.9B (May 2026)</col>
</row>
<row>
<col>Recent Volume Detail</col>
<col>~$30B total in June 2026, incl. ~$7B from the World Cup and ~$7B from new, fee-free crypto perpetual futures</col>
<col>U.S. arm: $1.3B (Apr 2026) → $1.8B (May 2026), ~20% of global volume</col>
</row>
<row>
<col>Category Mix</col>
<col>Sports 80%, politics 4%, and crypto 7% of trading volume since Jul. 2024; parlays rose to nearly 50% of volume during the 2026 World Cup</col>
<col>Sports 39%, politics 32%, and crypto 20% of trading volume since Jul. 2024; World Cup soccer volume exceeded $2B in the tournament's first 10 days</col>
</row>
<row>
<col>Users / Traders</col>
<col>Active traders: 240K → 1.2M (5x, during 2025). Super Bowl Sunday trading volume: $871M. Weekly trading volume: $2B (early 2026)</col>
<col>Active traders: 235K (Oct. 2024) → 450K (Jan. 2025, +91%). Super Bowl 2026 champion market volume: $704M. Weekly trading volume: ~$4.2B (Jul. 2026)</col>
</row>
Company milestones
.png)
Valuation in USD
<row>
<col>
Kalshi
LATEST FUNDING Series F · $1.0B · April 2026
Coatue · Sequoia Capital · Andreessen Horowitz · IVP · Paradigm · Morgan Stanley · ARK Invest
</col>
<col>
Polymarket
LATEST FUNDING Series E · $600.0M · Mar 2026
Intercontinental Exchange (ICE)
</col>
</row>
<row>
<col>
<card>
Primary round valuation
<span class="date">2026-04-02</span>
<span class="value">$22B</span>
</card>
</col>
<col>
<card>
Primary round valuation
<span class="date">2026-03-26</span>
<span class="value">$15B</span>
</card>
</col>
</row>
<row>
<col>
<card>
Secondary market valuation
<span class="date">2026-09-21</span>
<span class="value">$38.64B</span>
</card>
</col>
<col>
<card>
Secondary market valuation
<span class="date">2026-09-21</span>
<span class="value">$13B</span>
</card>
</col>
</row>
<row>
<col>
<card>
Valuation change
<span class="date">Primary → secondary</span>
<span class="value green">+75.62%<span>
</card>
</col>
<col>
<card>
Valuation change
<span class="date">Primary → secondary</span>
<span class="value red">-13.35%<span>
</card>
</col>
</row>
Note: Polymarket is reportedly raising $1B at a $21B post-money valuation, while Kalshi is reportedly in talks to raise at least $750M at a $40B valuation.
Quarterly bid-to-ask volume ratio
MSCI Private Company Insights presents the quarterly bid-to-ask volume ratio of Kalshi and Anthropic from 2026 Q1 to 2026 QTD.
- Largest bid-side volume: Kalshi peaked at $586.1 million (17% of total volume) in QTD, versus Polymarket at $182.5 million (15%) in Q1
- Largest ask-side volume: Kalshi peaked at $2.83 billion (83% of total volume) in QTD, versus Polymarket at $1.52 billion (95%) in QTD
Comparable company overview
MSCI Private Company Insights provides a comparative view of Kalshi and Polymarket based on revenue, 90-day price change, valuation change since the last funding round and year-to-date (YTD) composite price volatility.
.png)
.png)
.jpg)
%201.png)
.jpg)
.jpg)

.jpg)
.jpg)
.jpg)
.jpg)
