.jpg)
VC Secondary Market Trends | May 2026 | MSCI Private Company Insights
Institutional secondary market-driven data insights covering a universe of private venture-backed companies.
June 17, 2026
MSCI Private Company Insights provides an overview of private market activity covering sector trends, company-level insights, and monthly performance metrics.
The May 2026 report highlights movements in performance, volatility, volumes, and valuations, while tracking institutional involvement and comparing current secondary market prices to recent funding rounds.
Key takeaways
- PM50 growth: Month-on-month (MoM) performance was +1.25% in May, down from +3.90% in April 2026, while remaining positive.
- Sector return: Transportation led sector performance with a +16.96% MoM gain
Sector performance reflects secondary market activity and may be influenced by a small number of transactions in any given month. - Monthly bid-ask volume: Volume rose to $37.81 billion in May from $27.82 billion in April
- Largest increase: Addepar's bid-ask volume was up +400.65% in May, from $3.86 million to $19.30 million
- Largest decrease: Mercury's bid-ask volume was down -95.23% in May, from $151.10 million to $7.20 million
Source: MSCI Private Company Insights secondary market data. Unless otherwise stated, all analysis and statistics in this report are derived from MSCI Private Company Insights observations of secondary market activity and all amounts are in US dolllars (USD). Data as of May 31, 2026. Past performance, whether actual, backtested or simulated, is no indication or guarantee of future performance.

Monthly statistics
|| Monthly statistics from January 2021 until May 2026
Monthly PM50 Growth performance
The chart below shows PM50 Growth’s month-on-month performance.
- Early growth phase (2021)
- January 2021 – Returns reached a peak of +16.25%, showing strong early gains
- Market correction period (2022 - Early 2023)
- June 2022 – Performance dropped to a low of -10.50% after a steady decline
- Mid 2022 to Early 2023 – Returns remained largely negative, reflecting weak market conditions
- Recovery and expansion (Mid- 2023 to 2025)
- May 2023 onward – Performance turned positive, with momentum gradually building
- February 2025 – Returns climbed to a post-rebound high of +15.33%
- May 2026 – Performance settled at +1.25%, reflecting a slowdown after a period of stronger returns
.png)
The PM50 Growth tracks the performance of the 50 most active private names observed in the secondary market. It is an equal-weighted index, rebalanced on a monthly basis. This rebalancing of constituents over time allows more active names to be represented in the measure of market performance as market activity evolves.
Monthly institutional level activity
The chart below shows the monthly count of institutional-level (1M+) bid, ask, or trade contributions.
- Reduced participation period
- December 2021 – Recorded the lowest levels at 185 contributions, highlighting reduced interest
- Notable activity spikes
- April 2022 and March 2023 – Marked by notable spikes of 636 and 688 transactions
- Peak institutional demand
- January 2026 – Activity reached a record high of 1,065 contributions for the period
- Recent trends
- May 2026 – Activity declined to 832, reflecting a slowdown from the high of 1,065 recorded in January
.png)
Monthly total bid and ask volume
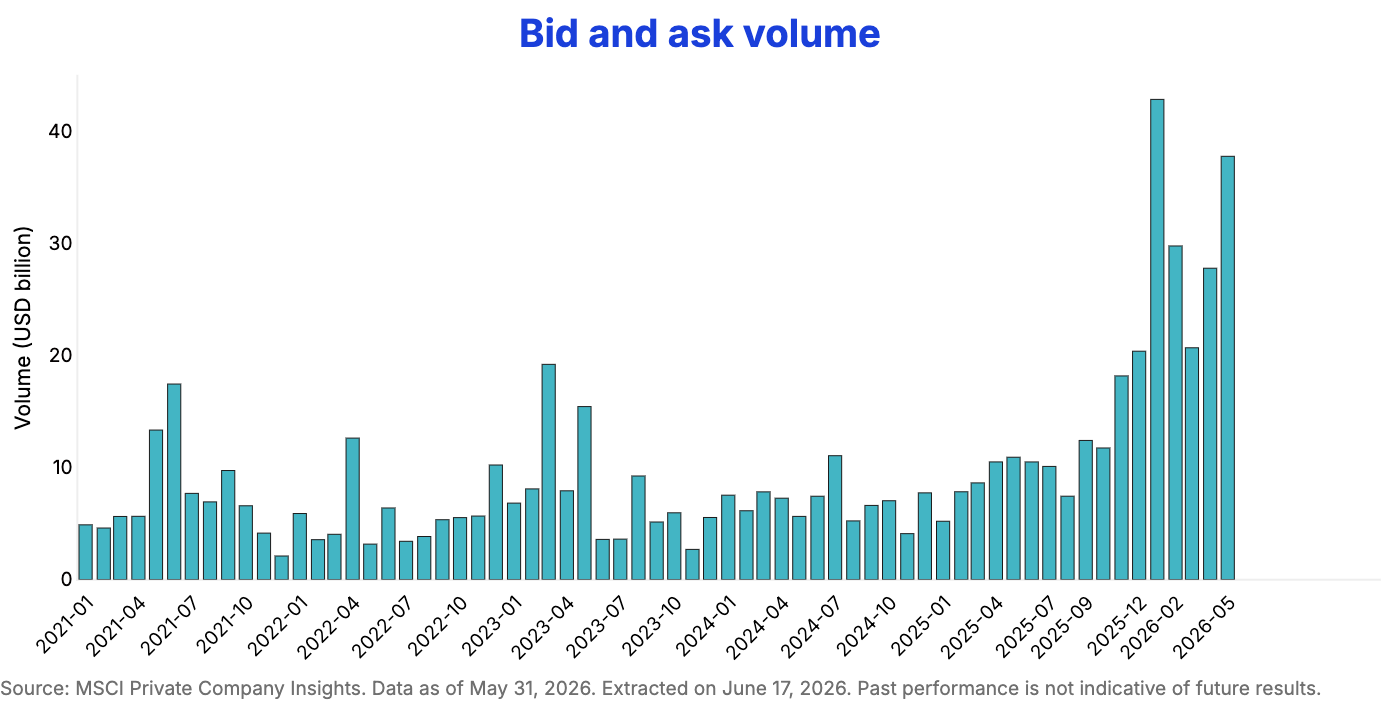
The chart below presents total monthly bid and ask volumes tracked by MSCI Private Company Insights.
- Reduced liquidity period
- December 2021 – Fell to $2.12 billion, reflecting reduced activity
- Notable volume spikes
- April 2022 and March 2023 – Volume surged to $12.64 billion and $19.23 billion, respectively
- Peak volume
- January 2026 – Volume peaked at $42.89 billion, nearly double the prior peak of $20.41 billion in Dec 2025
- Recent market conditions
- May 2026 – Volume remained near historically elevated levels at $37.81 billion, despite declining from January’s peak of $42.89 billion
Monthly bid and ask volume ratio
The stacked bar chart below shows the total monthly bid and ask volumes alongside their relative ratios.
- Largest bid-side activity: 57% of $4.90 billion in January 2021
- Largest ask-side activity: 94% of $12.64 billion in April 2022
- May 2026: Ask-side activity was 85% of $37.81 billion
Ask-side dominance of 85% in May 2026 reflects a market where sellers continue to outnumber buyers, consistent with the broader private market trend of muted liquidity.
.png)
Monthly mean volume per indication type
The chart below presents the monthly average volumes for asks, bids, and trades over the period from January 2021 to May 2026.
- Asks:
- Highest average ask volume: $43.25 million in June 2021
- Lowest average ask volume: $7.59 million in January 2024
- May 2026 average ask volume: $15.79 million, up +30.49% from April 2026
- Bids:
- Highest average bid volume: $33.58 million in June 2021
- Lowest average bid volume: $6.12 million in February 2022
- May 2026 average bid volume: $13.63 million, down -20.48% from April 2026
- Trades:
- Highest average trade volume: $15.65 million in June 2021
- Lowest average trade volume: $1.18 million in October 2024
- May 2026 average trade volume: $2 million, down -62.48% from April 2026
- All:
- Highest average volume: $33.82 million in June 2021
- Lowest average volume: $7.26 million in November 2023
- May 2026 average volume: $13.04 million, up +15.41% from April 2026
Average trade and bid volumes declined significantly month-on-month in May, while ask volumes remained elevated, suggesting stronger selling interest that did not translate into completed transactions.
.png)
Private & public sector
|| Performance from December 31, 2025 until May 31, 2026
<row>
<col>
.png)
</col>
<col>
.png)
</col>
</row>
The PM50 Growth tracks the performance of the 50 most active private names observed in the secondary market. It is an equal-weighted index, rebalanced on a monthly basis.
This rebalancing of constituents over time allows more active names to be represented in the measure of market performance as market activity evolves.
Private market: sector level for May 2026
|| Sector-level analysis for May 2026
MoM performance
The graph below displays the MoM performance, broken down by MSCI Private Company Insights’ actively tracked sectors, covering the period from April 28, 2026 to May 31, 2026.
- Strongest gain: Transportation led sector performance with a +16.96% gain
- Highest decline: Talent Management declined -8.16%, marking the weakest sector performance
- PM50 Growth: Recorded a +1.25% return, remaining in positive territory
.png)
Volatility of performance
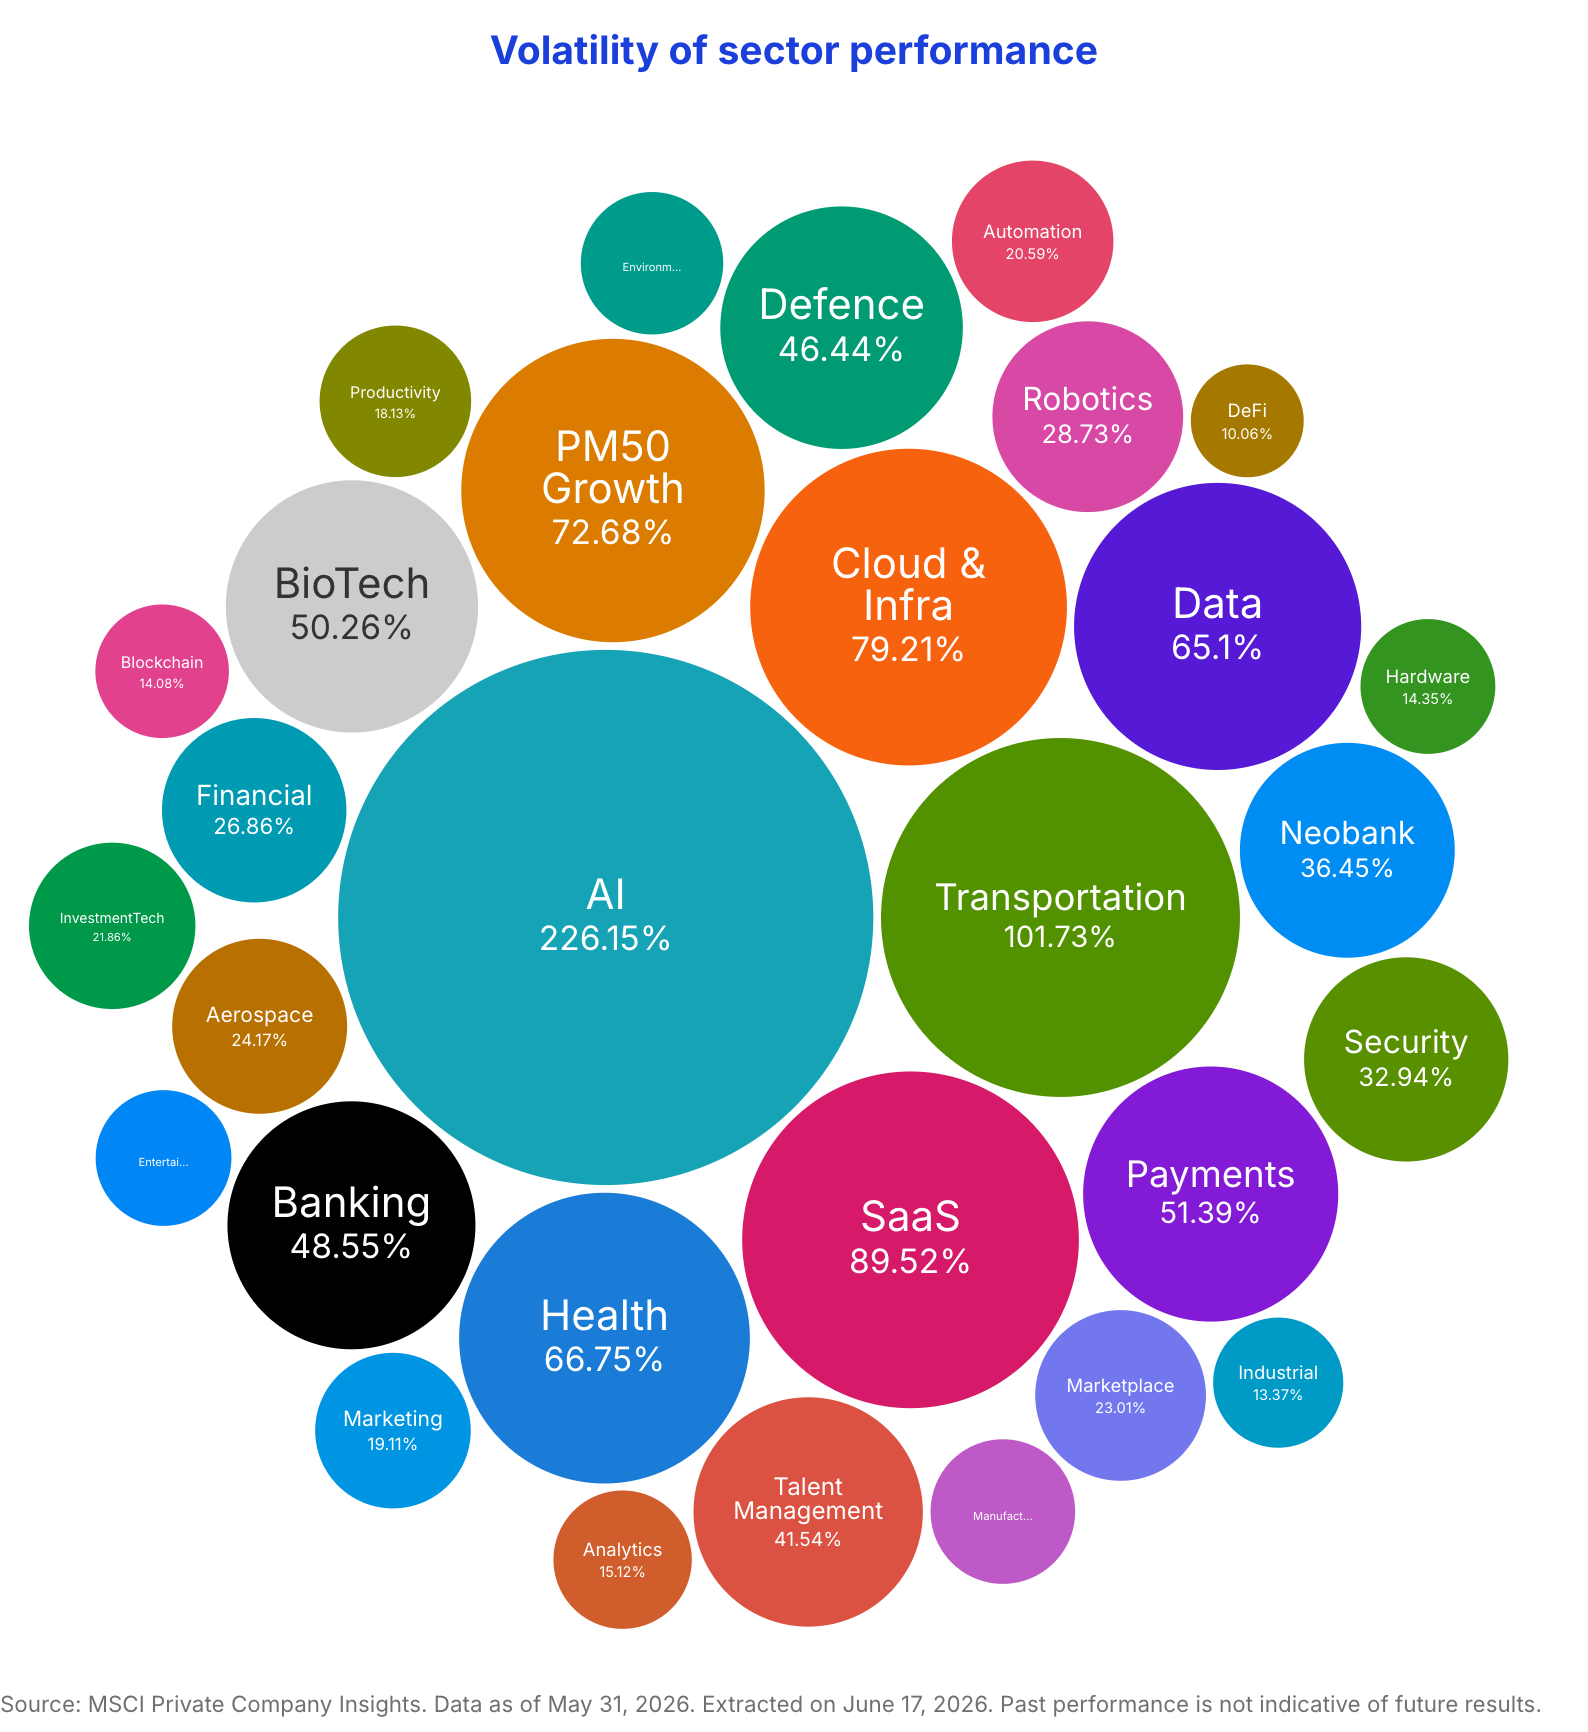
The volatility of the performance is calculated based on the performance movements within a 90-day rolling window ending on that date. Performance is calculated from the start of 2021. The graph below shows the top 20 sectors ranked by performance volatility as of May 31, 2026.
- Highest volatility: AI recorded the highest volatility at 226%, reflecting price fluctuations and elevated investor uncertainty
- Lowest volatility: Automation recorded the lowest volatility at 21%, indicating relatively stable and consistent performance
- PM50 Growth: Volatility stood at 73%, suggesting a moderate level of return variability compared with the broader sector range
Total bid and ask volume ratio
The stacked bar chart below highlights total ask and bid volumes, along with their ratios, across sectors for selected companies with notable activity during the time period between May 1, 2026 and May 31, 2026.
- Highest ask ratio: Banking and Neobank sector recorded the strongest sell-side pressure, with asks accounting for 96.32% of its $1.51 billion total volume
- Highest bid ratio: Data sector led in buy-side activity, with bids making up 48.06% of their $635 million total volume
- PM50 Growth: Sell-side activity dominated, with asks representing 84.86% of the $34.33 billion in total volume
.png)
Most active names performance across all sectors
Data as of May 31, 2026
90-day performance: Trend of return on composite price
90-day diff price(%): Change in composite price in terms of percentage
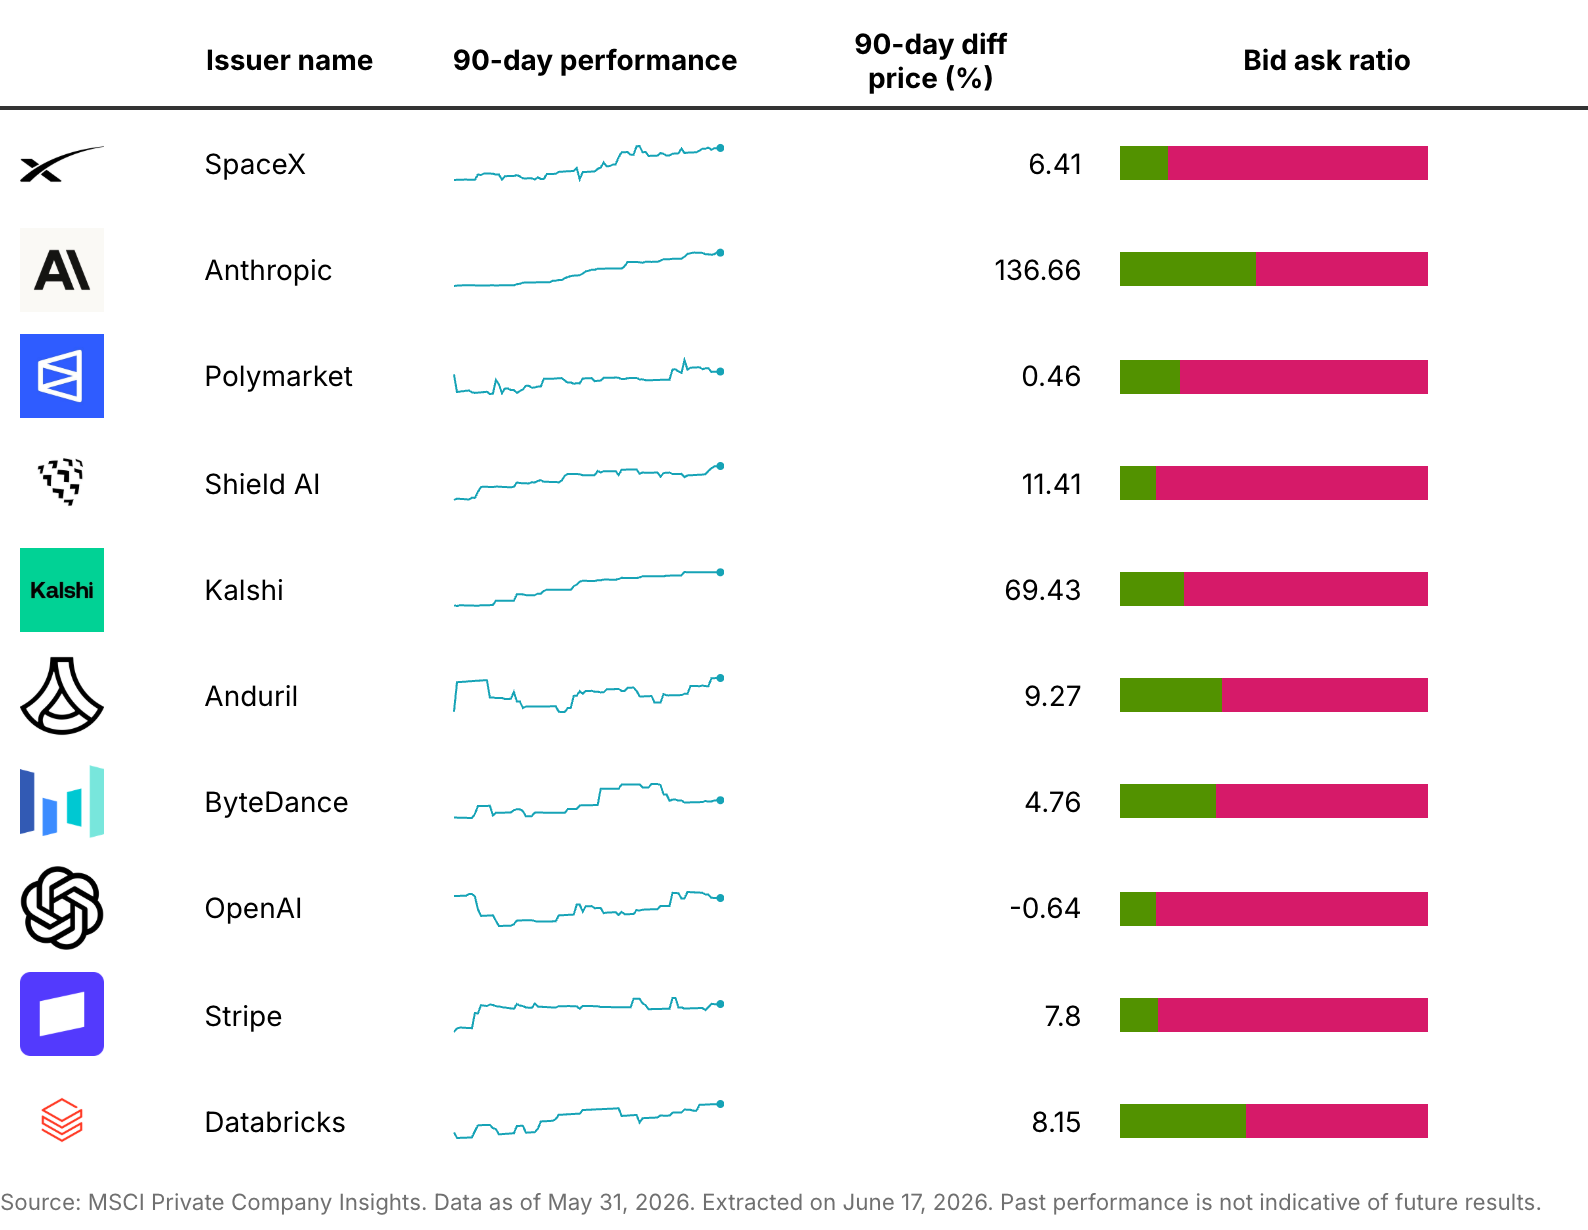
Price (USD) estimated based on secondary market activity observed by MSCI Private Company Insights. Valuation is estimated based on said price and share count from state filings and/or news in the public domain. Note that share count in calculations may change as new filing documents are obtained.
Change in secondary market price in May
MSCI Private Company Insights highlights the top five and bottom five companies in terms of change in composite price between April 30, 2026 and May 31, 2026 with significant activities i.e. at least 3 institutional-level contributions — to identify those experiencing the most notable shifts in market sentiment.
- Strongest gain: Crusoe Energy's composite price rose by +27.34%
- Largest decline: Colossal Biosciences' composite price fell -33.24%
.png)
Change in total bid and ask volume
MSCI Private Company Insights highlights the top five and bottom five companies with significant activities in terms of change in monthly total bid and ask volume between April 30, 2026 and May 31, 2026.
- Largest increase: Addepar, up +400.65%, from $3.86 million to $19.30 million
- Largest decrease: Mercury, down -95.23%, from $151.10 million to $7.20 million
.png)
Proportion of change in valuation
The chart below highlights the ratio of companies in MSCI Private Company Insights' universe current trading levels relative to recent round valuations.
- Latest vs prior round: 87% of 147 companies raised new funding at a higher valuation than their previous round
- Latest round vs current secondary market activity: 72% of companies are currently trading at lower valuations than their latest round
.png)
.png)
.jpg)
%201.png)
.jpg)
.jpg)

.jpg)
.jpg)
.jpg)
.jpg)
