.jpg)
VC Secondaries Market Report Q3 2025 | PM Insights Quarterly Update
PM Insights Q3 2025 in Review
October 1, 2025
|| October 1, 2025
PM Insights provides independent, market-driven data for Private Growth and Pre-IPO companies, providing unparalleled transparency and helping asset managers, consultants, banks, and regulators understand trading conditions and risk in this dynamic market.
This report provides a comprehensive analysis of Q3 2025 market performance, capturing a quarter defined by divergent sector dynamics and shifting investor sentiment across private markets. Standout performers emerged amid broader market turbulence, reflecting evolving investment priorities and changing conviction in high-growth technology companies. This analysis examines the key trends, sector movements, and notable developments that defined the quarter and their implications for navigating an increasingly dynamic investment landscape.
Key Takeaways
- PM50 Growth: ROI increased by 16.15%, though volatility in returns reached 95.02%
- Sector Return: The Data sector experienced consecutive quarterly declines, falling 3.3% in Q2 2025 and 2.48% in Q3 2025
- Sector Volatility: Volatility in the AI sector intensified significantly, climbing from 56.7% in Q2 2025 to 292.62% in Q3 2025
- Quarterly Bid-Ask Volume: Bid-Ask volume declined to $21.47 billion in Q3 2025, down from $25.83 billion in the previous quarter
- Top Performer: Anthropic led the sector with a remarkable 129.33% gain QoQ

Q3 2025 Venture Market Insights
IPOs kept rolling along in Q3 boosting secondary demand.
A number of notable IPOs came to market in Q3 including Klarna, Netskope and Figma. Though the results were mixed with some doing better than others since IPO, it still helped boost secondary demand with bids climbing to 40% of total observed volume (vs 36% in previous quarter).
High levels of concentration remains.
Most of the activity in terms of count and overall volume is still concentrated in the top names. The dispersion into the broader market remains slow, despite increasing interest in names with upcoming IPO potential. AI (both on the LLM and on the infra side) continues to attract a great deal of activity and interest driving valuations ever higher.
Overall returns improve quarter over quarter.
While the political uncertainty remains, with the US government shutdown no doubt weighing on inverstor minds (especially as it may derail the IPO train, if protracted) the Q3 returns were more than double that of Q2 at c. 16% for the most active 50 companies as represented by the PM50 Growth benchmark, with Perplexity, Anthropic and Kraken being major contributors.
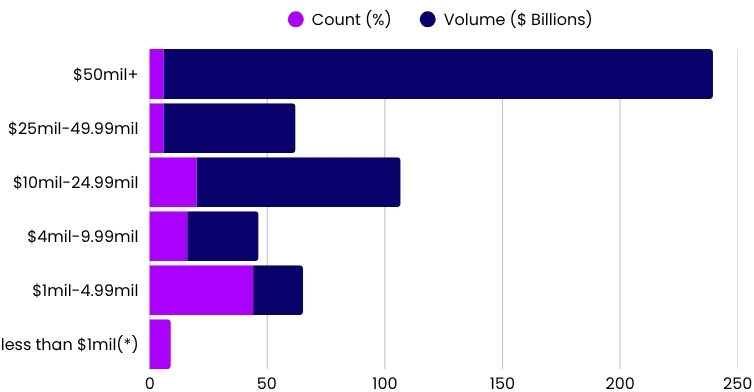
PM Insights Indication Volumes by Size Bucket
<row>
<col>
</col>
<col>
PM Insights is the leading market data provider for private company shares- delivering unmatched clarity, precision, and independence. Built exclusively for institutions requiring the most accurate, objective, and actionable data, research, and market insights.
(*) PM Insights does not use contributions with volume less than $1M in our composite calculation.
</col>
</row>
Private & Public Market ROI
.jpg)
The PM50 Growth tracks the performance of the 50 most active private names observed in the secondary market. It is an equal-weighted index, rebalanced on a monthly basis. This rebalancing of constituents over time gives way for more active names to participate in what we observe as "market performance," and in a more appropriate manner than static selections and weightings criteria.
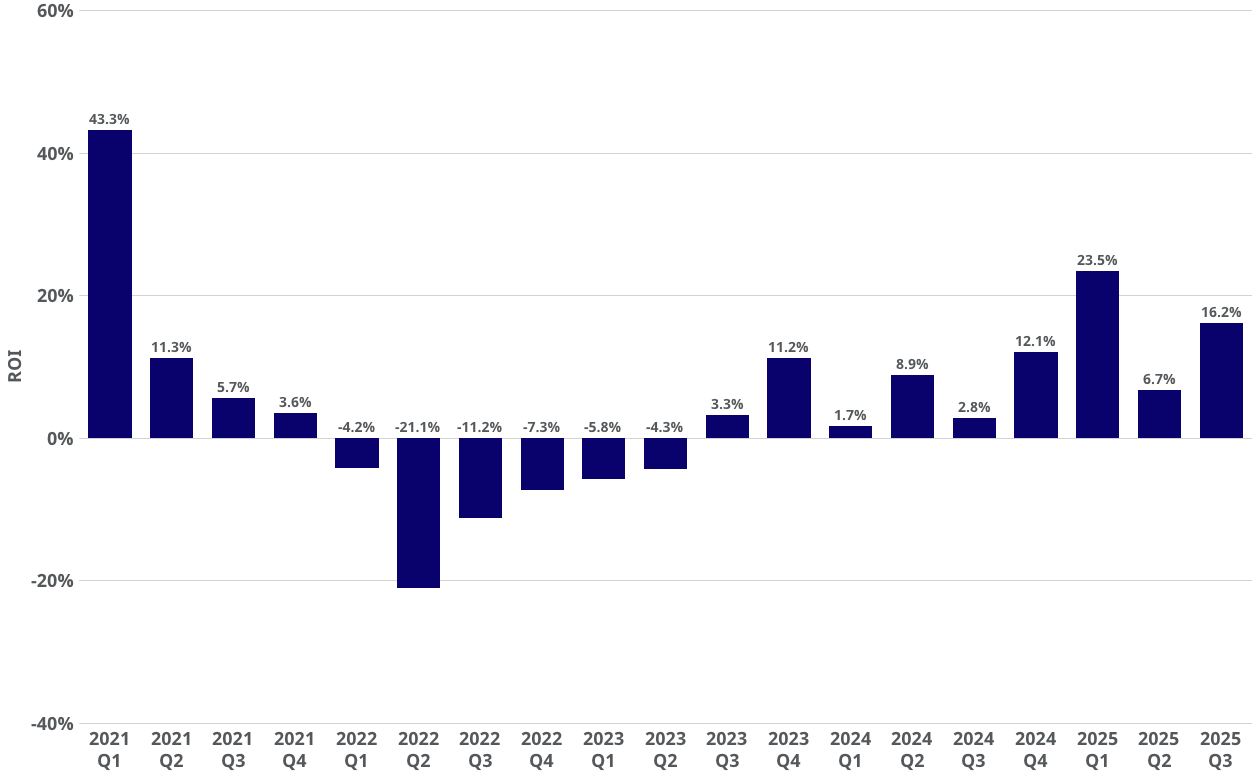
PM50 Growth Quarterly ROI
Private market ROI is on the rise.
The PM50 Growth Index, which tracks 50 of the most actively traded private companies, surged to a 16.2% ROI in Q3 2025, rebounding sharply from 6.7% in Q2.
During Q3 2025, eighteen private companies actively tracked by PM Insights completed IPOs, reflecting an increase from sixteen IPOs in Q2 2025. This progression highlights continued strengthening in private market liquidity and growing investor confidence, underpinning sustained momentum for private companies accessing public capital markets.
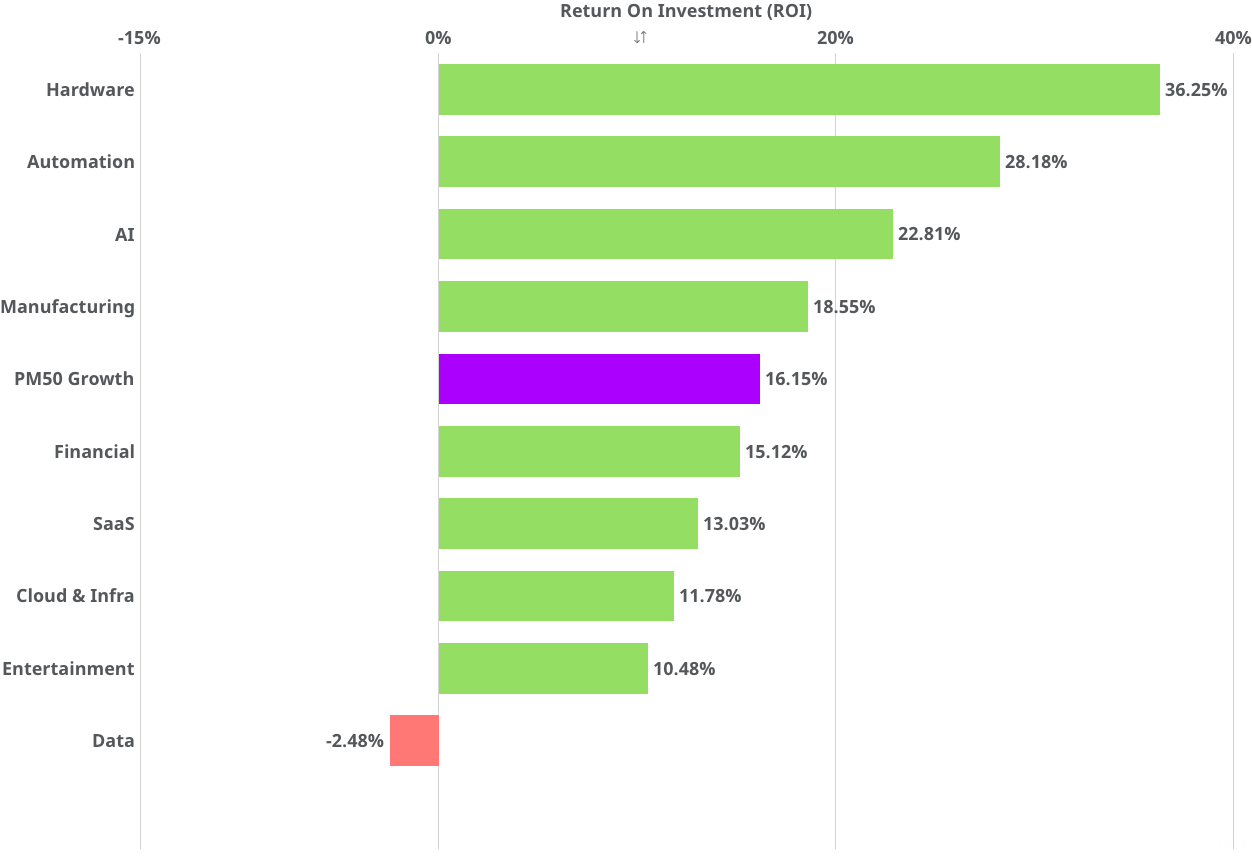
Q3 2025 Sector ROI
Mostly positive across PM Insights active indices in Q2 2025.
Significant number of sector indicies were in the green in Q3 2025. Unsurprisingly, AI, Automation and Hardware (mostly around AI and Robotics, as well as Defense tech) are leading the way.
However, across the board, more positive returns were observed and the headline PM50 Growth also posted a much stronger return for Q3 vs the previous quarter.
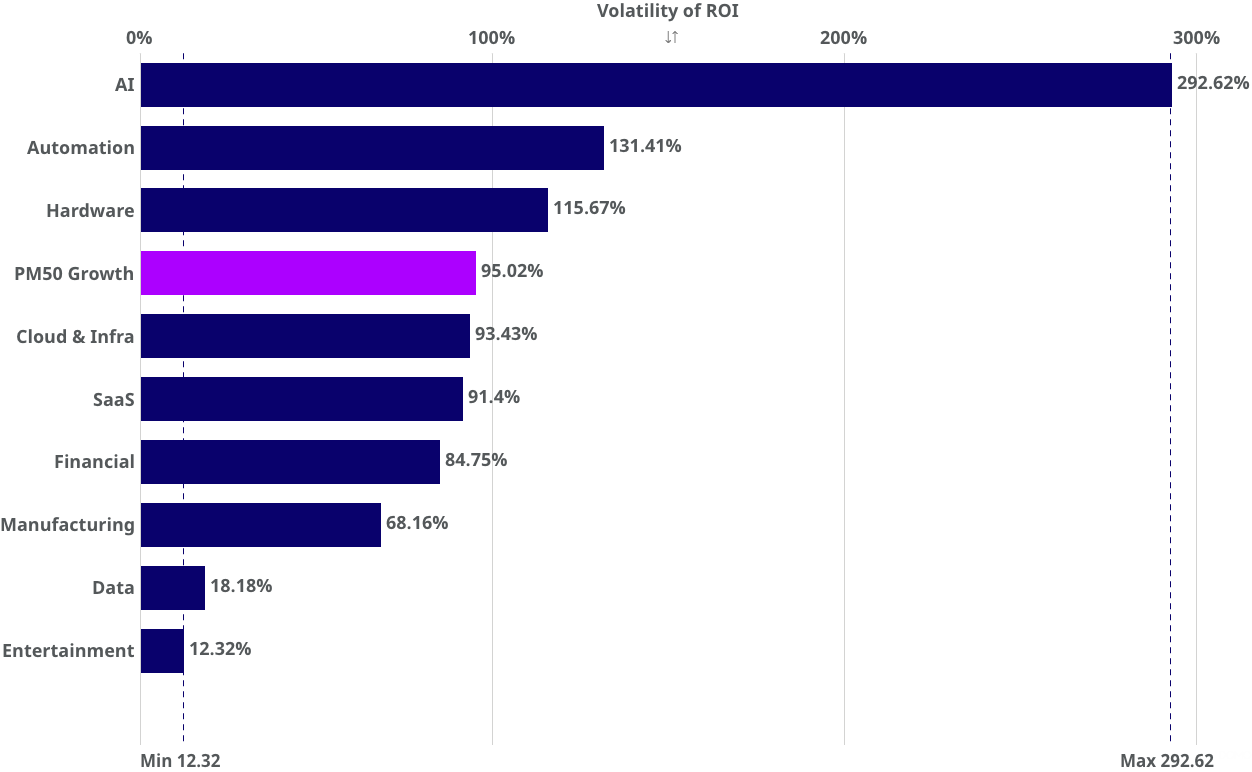
Quarterly Sector Volatility
Higher volatility in Q3 especially across AI names
Volatility rose again, mostly driven by surging AI names, with names like Anthropic and Perplexity pulling in very large primary hauls at substantially higher valuations.
But across the whole universe more volatility was evident with PM50 Growth index trippling in volatility in Q3. Much like with the AI names, most of the volatility drivers were positive jumps in names such as Apptronik, 1X and Anduril among others, as defence tech and robotics are converging and attracting more primary and secondary market demand.
Average Bid & Ask Spread per Sector

Median Revenue Multiple per Sector
Revenue multiples for the most active sector benchmarks continue on their upwards trajectory
Despite the bumpy end to Q1 the overall direction has remained very much up and to the right for revenue multiples in both Q2 and Q3 of 2025. The initial tumult from the tariffs and other policy uncertainty has receded and the positive momentum has returned to all major active sectors.
The positive IPOs were also seen as a major driver of positive sentiment and thus demand across sectors with AI still leading the way, but most seeing accelerating trends.
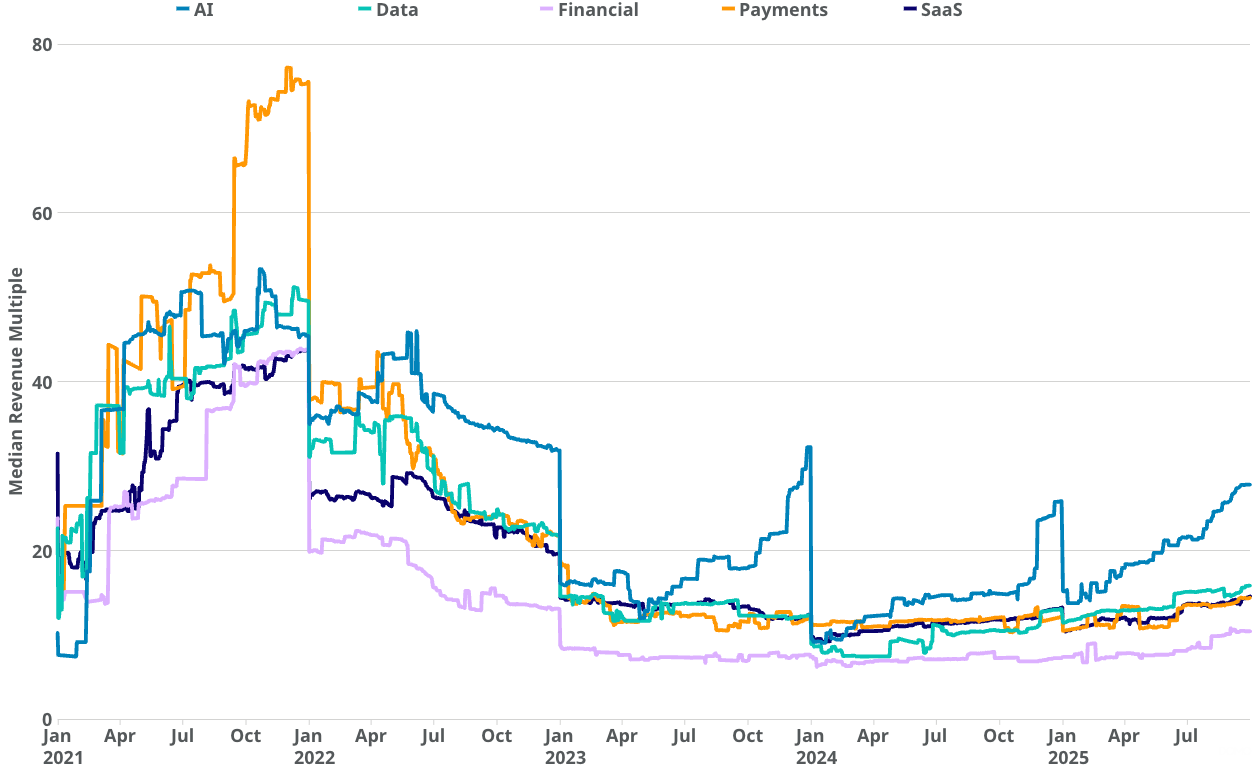
Note: The reset spikes in the data are typically due to new revenue figures for each of the 12-month annual figures
Activity
Q3'25 activity dropped lowest since Q1'23.
While large ticket activity ($50M+) has remained steady and volumes grew sligtly in Q3'25', there was a bit of a slowdown at the lower end of the institutional level ($1M-$5M) activity while returns remained positive. Investor interest was quick to return in May and June of 2025, but perhaps the continued prospect of a global economic slowdown due to ongoing trade tensions has discouraged some of the smaller investors from participating at this time.
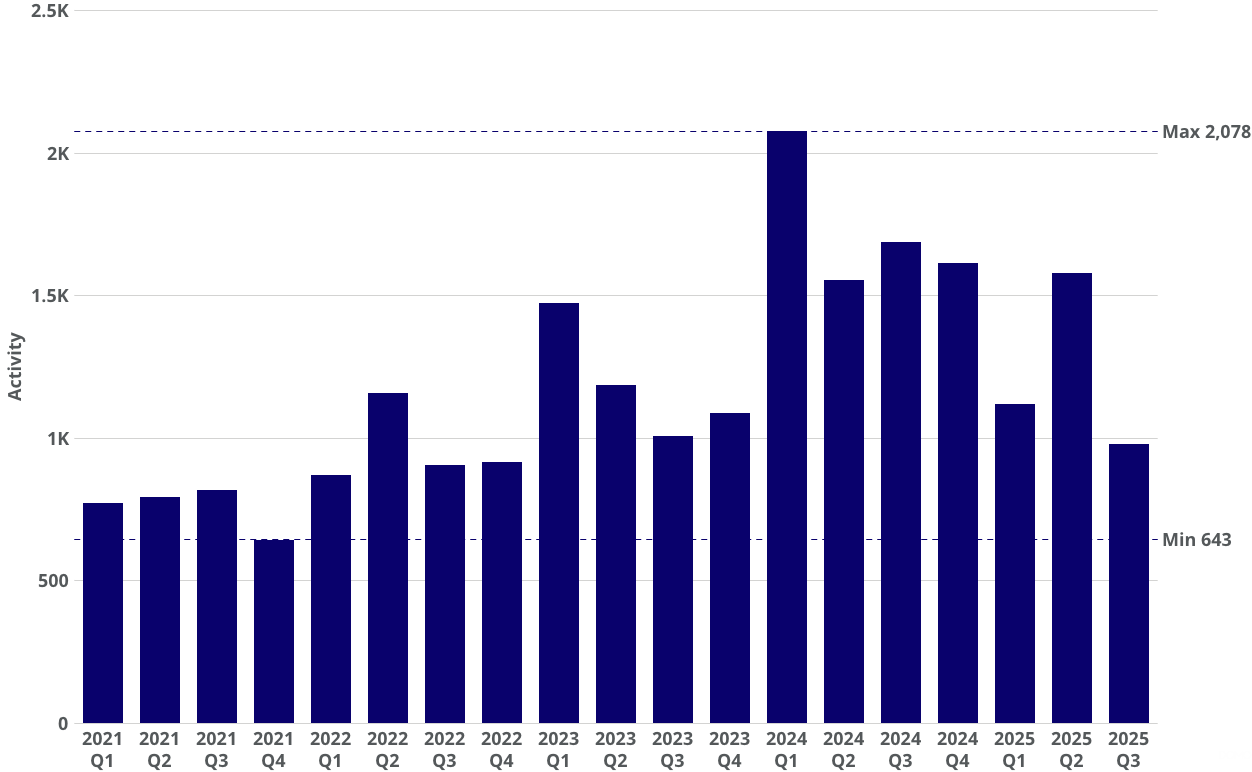
Note: Activity is calculated as number of contributions of institutional size ($1M+), data was deduplicated and doesn’t include outliers
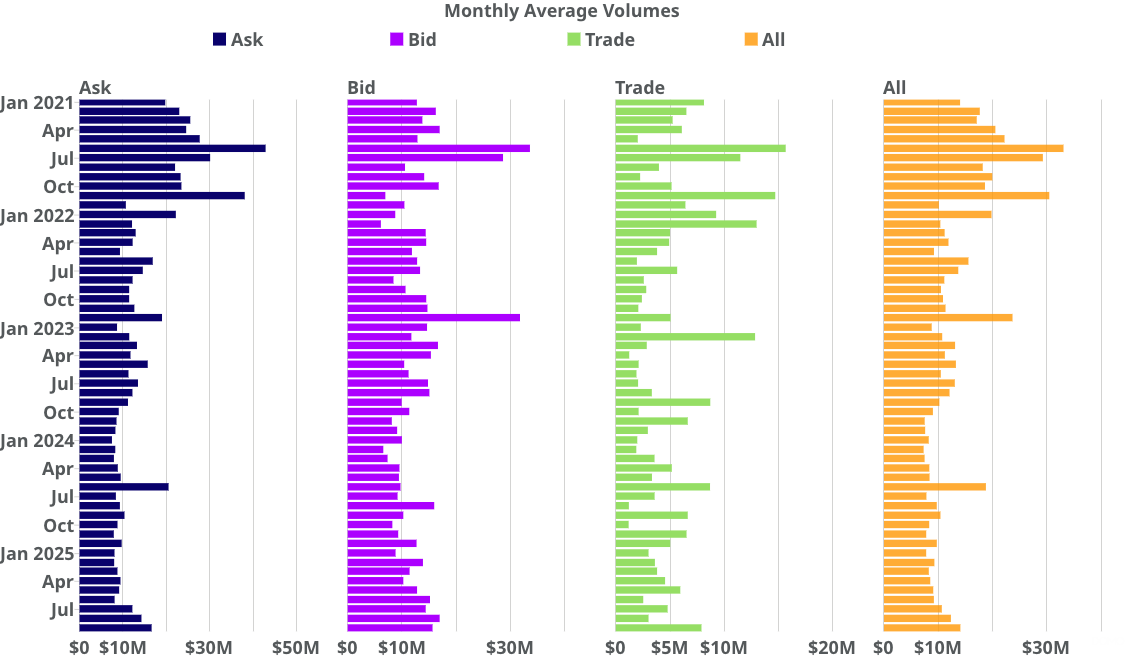
Mean Institutional Size Volume per Indication Type
All four types of quarterly average volumes increased.
Ask volumes, boosted by demand for pre-IPO potential liquidity saw average monthly volumes grow throughout the quarter approaching $15M average lot size.
Bid volumes, similarly saw higher average size throughout the quarter compared to previous quarter crossing $15M.
This likely also contributed to mean completed trade volume increasing significantly reaching $7.9M average in September.
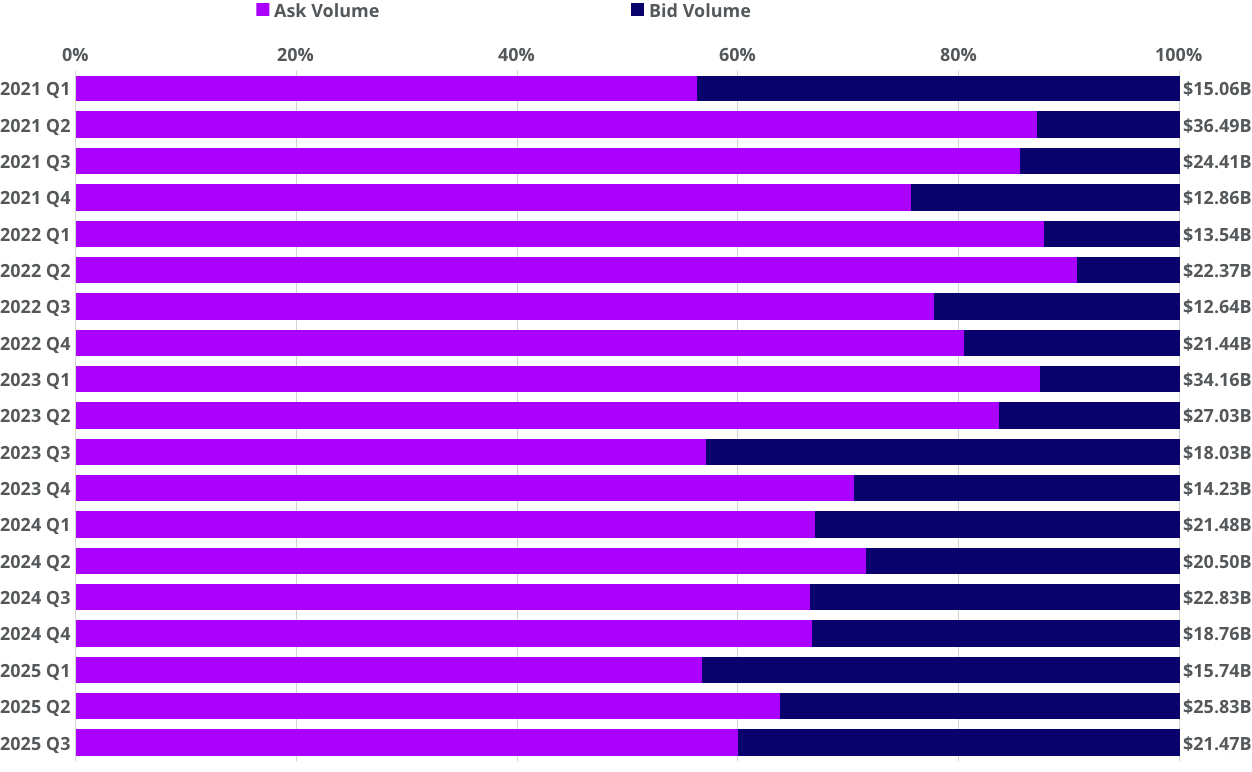
Quarterly Bid & Ask Volume
Overall volumes and bid-offer ratio returns to longer-term averages seen through 2024.
The overall volume for the quarter grew to levels similar to those observed in 2024. At the same time offers to bid volume ratio has also returned to levels seen last year, with offers covering 60% of total observed volume in the secondary space.
Top 10 Based on Bid or Ask Volume in Q3 2025
<row>
<col>
.jpg)
</col>
<col>
.jpg)
</col>
</row>
<row>
<col>
ByteDance dominates bid-side activity
ByteDance stood out with $2.31B in volume, more than $1B ahead of Anthropic. Marquee names like Stripe, Anduril and Databricks also drew meaningful investor interest.
</col>
<col>
Tighter competition on the ask-side
ByteDance also topped the sell-side at $2.02 billion, followed by SpaceX at 1.57B, though it dropped by almost half quarter-on-quarter and OpenAI at a similar level of $1.56B. The list leans AI heavy.
</col>
</row>
Top 10 Companies Based on Overall Volume
ByteDance leads, Anthropic rises.
ByteDance remained the clear leader in secondary market volume this quarter at $4.33B, though size fell from $5.22B in Q2. SpaceX also saw a pullback to $1.75B from $3.72B, slipping behind Anthropic ($2.00B) and OpenAI ($1.85B). Stripe held steady at $1.61B, while Kraken, Anduril, and xAI all crossed the $1B threshold.
<row>
<col>
.jpg)
</col>
<col>
.jpg)
</col>
</row>
Top 10 Based on Institutional Contributions During the End of Q3 2025
Data as of September 30, 2025.
.png)
Q3 2025 Percentage Change in share price
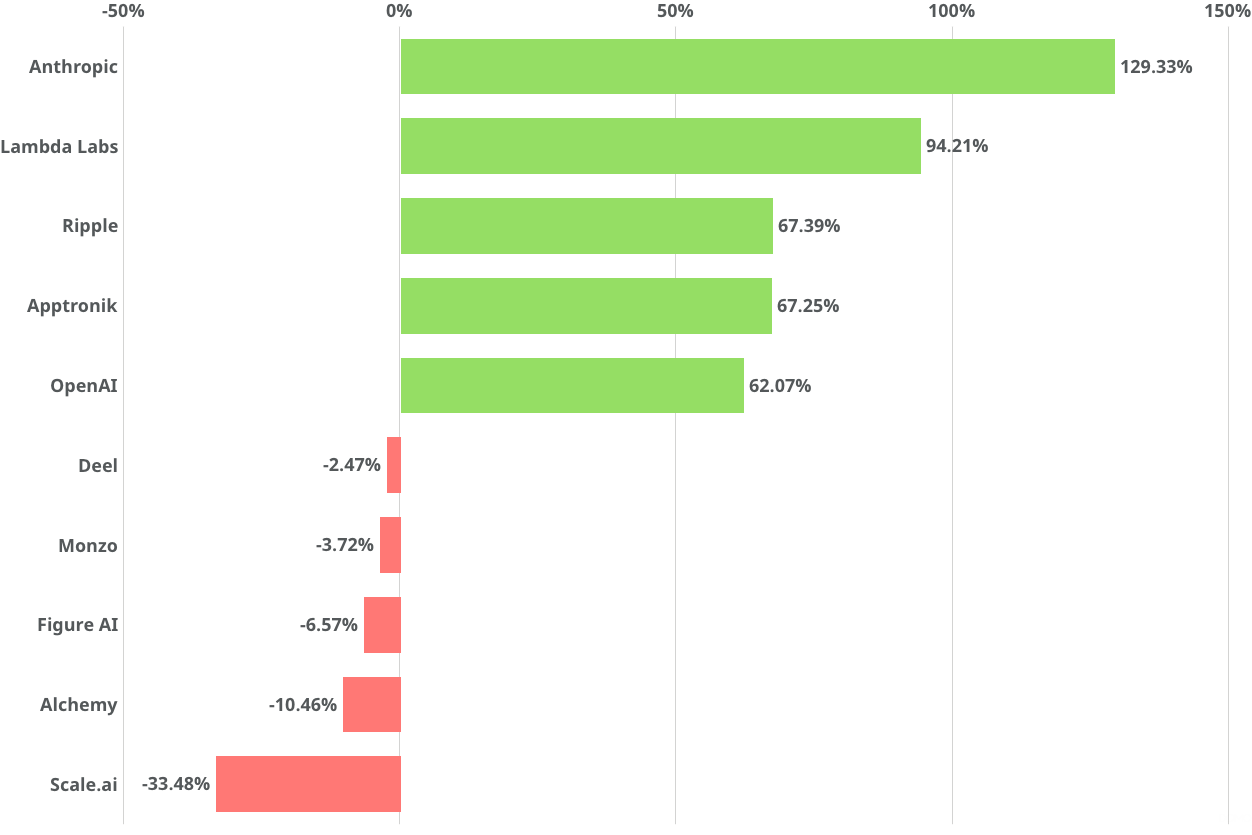
Anthropic leads the surge.
While AI hype continues to capture investor attention and capital, the biggest leap this quarter came from Anthropic, with its share price up more than 129%. Lambda Labs, Ripple, Apptronik, and OpenAI also delivered strong gains, each climbing well over 60%.
Not all companies shared in the momentum. Deel, Monzo, Figure AI, and Alchemy slipped into negative territory, while Scale AI faced the sharpest drop, falling more than 33% on the back of the Meta deal.
Proportion of Change in Valuation
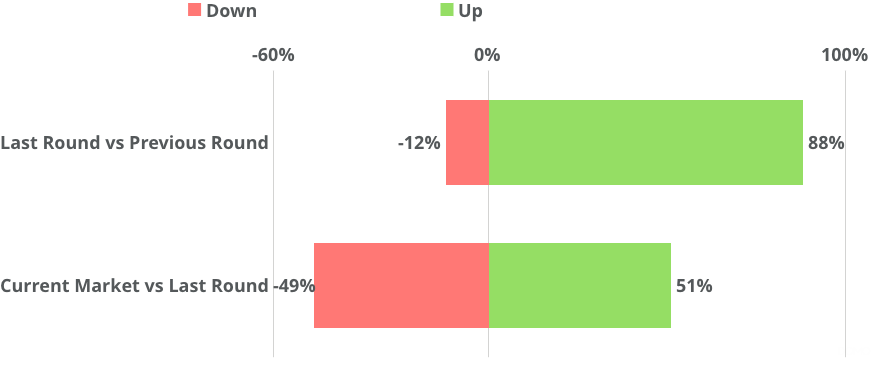
88% of companies in PM Insights’ universe were valued higher in the latest round vs the rounds prior.
The percentage of companies raising rounds at higher price than previous round fell from 91% seen last quarter to 88% this quarter. Companies traded at a discount compared to their most recent round fell to 49%, an improvement from 57% seen in Q2’ 25's report. While discounts still account for nearly half the universe, the share trading at or above their last round valuation continues to grow.
Average Change in Valuation
<row>
<col>
.jpg)
As of the end of Q3 2025, companies’ latest funding rounds versus prior rounds showed a wide range: the mean positive change in valuation was triple and the median positive change was double, compared to a halving in valuation among companies with negative change for both mean and median.
</col>
<col>
However, upward swings were more muted when comparing PM Insights' current implied valuations to recent primary rounds, with a median and median increase of just +23.67% and +41.28%, respectively, while the downside is steeper, with a mean decline of -33.55% and median of -27.79%.
.jpg)
</col>
</row>
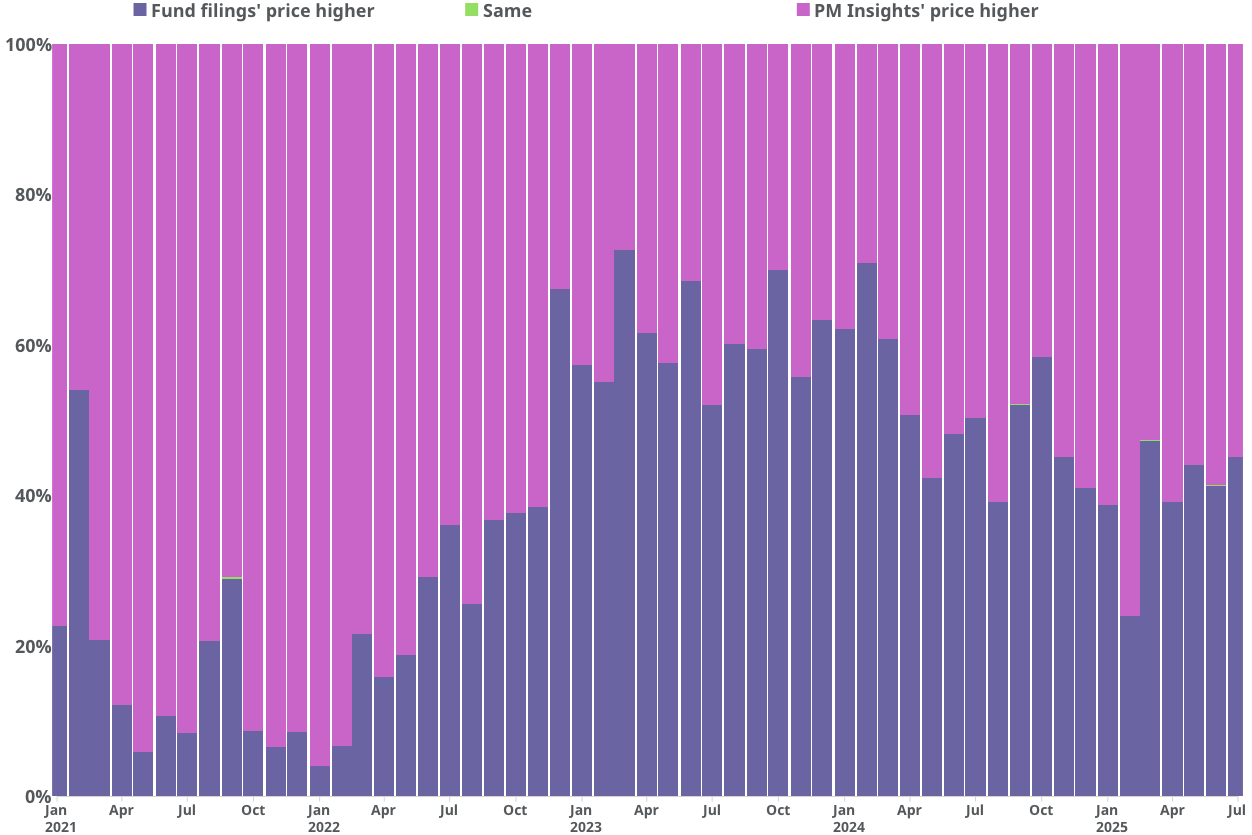
PM Insights Price vs Mutual Fund Price
Historically, mutual funds have marked their positions in late-stage private companies at or above the most recent primary funding round valuation.
As markets cooled, many mutual funds were slow to reflect the broader sentiment, resulting in PM Insights' valuations (based on institutional secondary market activity) increasingly falling below mutual fund marks for those companies.
Since late 2024 (with filings typically delayed by a quarter) and into 2025, this relationship has shifted again. PM Insights’ valuations are now more frequently above mutual fund marks.
%201.png)
.jpg)
.jpg)

.jpg)
.jpg)
.jpg)
.jpg)
.jpg)
.jpg)
