%201.png)
Ramp Valuation Hits $32B on 54% Revenue Growth
Weekly Edition & Stock Spotlight
November 18, 2025
PM Insights provides independent, market-driven data for Private Growth and Pre-IPO companies, providing unparalleled transparency and helping asset managers, consultants, banks, and regulators understand trading conditions and risk in this dynamic market.
This report examines Ramp's position in the corporate spend management and financial operations software market, highlighting accelerating enterprise adoption, expanding product capabilities, and diversifying revenue streams. With strong growth in enterprise accounts generating recurring SaaS revenue, a $32 billion valuation reflecting investor confidence, and platform expansion across expense management, accounts payable automation, procurement, and corporate card workflows, Ramp is establishing itself as a comprehensive financial operations platform for mid-market and large enterprises. These factors strengthen the company's competitive position in the spend management software market and support momentum toward higher software margins and increased market share in corporate expense management.
Key Takeaways
- Ramp's Revenue: As of October 2025, revenue is up 54.25% from $648 million in 2024
- Strong Return on Investment (ROI): Ramp delivered gains of +48.41%, +20.81%, and +8.23% over the past 180, 90, and 30 days, respectively
- Valuation Momentum: Ramp’s latest round E-3 valued the company at $32 billion, up from $22.5 billion just four months after its E-2 raise
- Elevated Volatility: Volatility spiked to 35.66% in early September, before stabilizing near 35.55% by November 17, 2025

ROI Private & Public
|| ROI from December 31, 2024 until November 17, 2025.
.jpg)
The PM50 Growth tracks the performance of the 50 most active private names observed in the secondary market. It is an equal-weighted index, rebalanced on a monthly basis.
This rebalancing of constituents over time gives way for more active names to participate in what we observe as "market performance," and in a more appropriate manner than static selections and weightings criteria.
Most Active Names Performance Across All Sectors
Data as of November 17, 2025.
90D Return △ - Trend of return on composite price
90D % △ - Change in composite price in terms of percentage
Implied Mkt Cap* - Implied market capitalization based on composite price
90D Implied Mkt △ - Change in implied market capitalization
.png)
Stock Spotlight -Ramp
.png)
Sectors
Financial Banking Neobank
Headquarters
New York, New York, USA
CEO
Eric Glyman
“Money talks. Now it thinks.”
Ramp is a corporate spend management platform that helps businesses automate expense management, control corporate card spending, and streamline financial operations. Operating in the competitive B2B fintech and spend management software market, Ramp differentiates itself by combining corporate cards with integrated expense tracking, accounts payable automation, procurement management, and AI-powered spend controls. The platform serves finance teams looking to replace disconnected tools with a unified spend management system that delivers automated expense reporting, policy enforcement, and real-time financial insights. Ramp's positioning emphasizes measurable cost savings and operational efficiency for businesses managing expenses across cards, bills, vendors, and travel.
Business Model
Ramp operates a dual-revenue model combining payment processing economics with software-as-a-service subscriptions. The company earns interchange revenue when businesses use Ramp corporate cards for purchases, generating income from transaction volume without charging annual fees. Beyond card interchange, Ramp monetizes through subscription fees for its spend management software, including accounts payable automation, procurement tools, vendor payments, travel and expense management, and automated reconciliation features. As customers adopt multiple products within the platform, the revenue mix shifts toward higher-margin recurring software revenue, creating a more diversified business model beyond card-based interchange fees.
Scale and Growth
- Ramp valuation and revenue: Valued at $32B with $1B+ annualized revenue, positive free cash flow in 2025
- Spend management transaction volume: Processes $100B+ in annual corporate card and payment volume
- Corporate customer base: Serves 50,000+ businesses, from startups to Fortune 500, doubling customers year-over-year
- Enterprise spend management adoption: Generates $100K+ annual recurring revenue from 2,200+ enterprise accounts
- Growth drivers: Growth driven by multi-product adoption, AI-powered spend automation, and legacy system consolidation
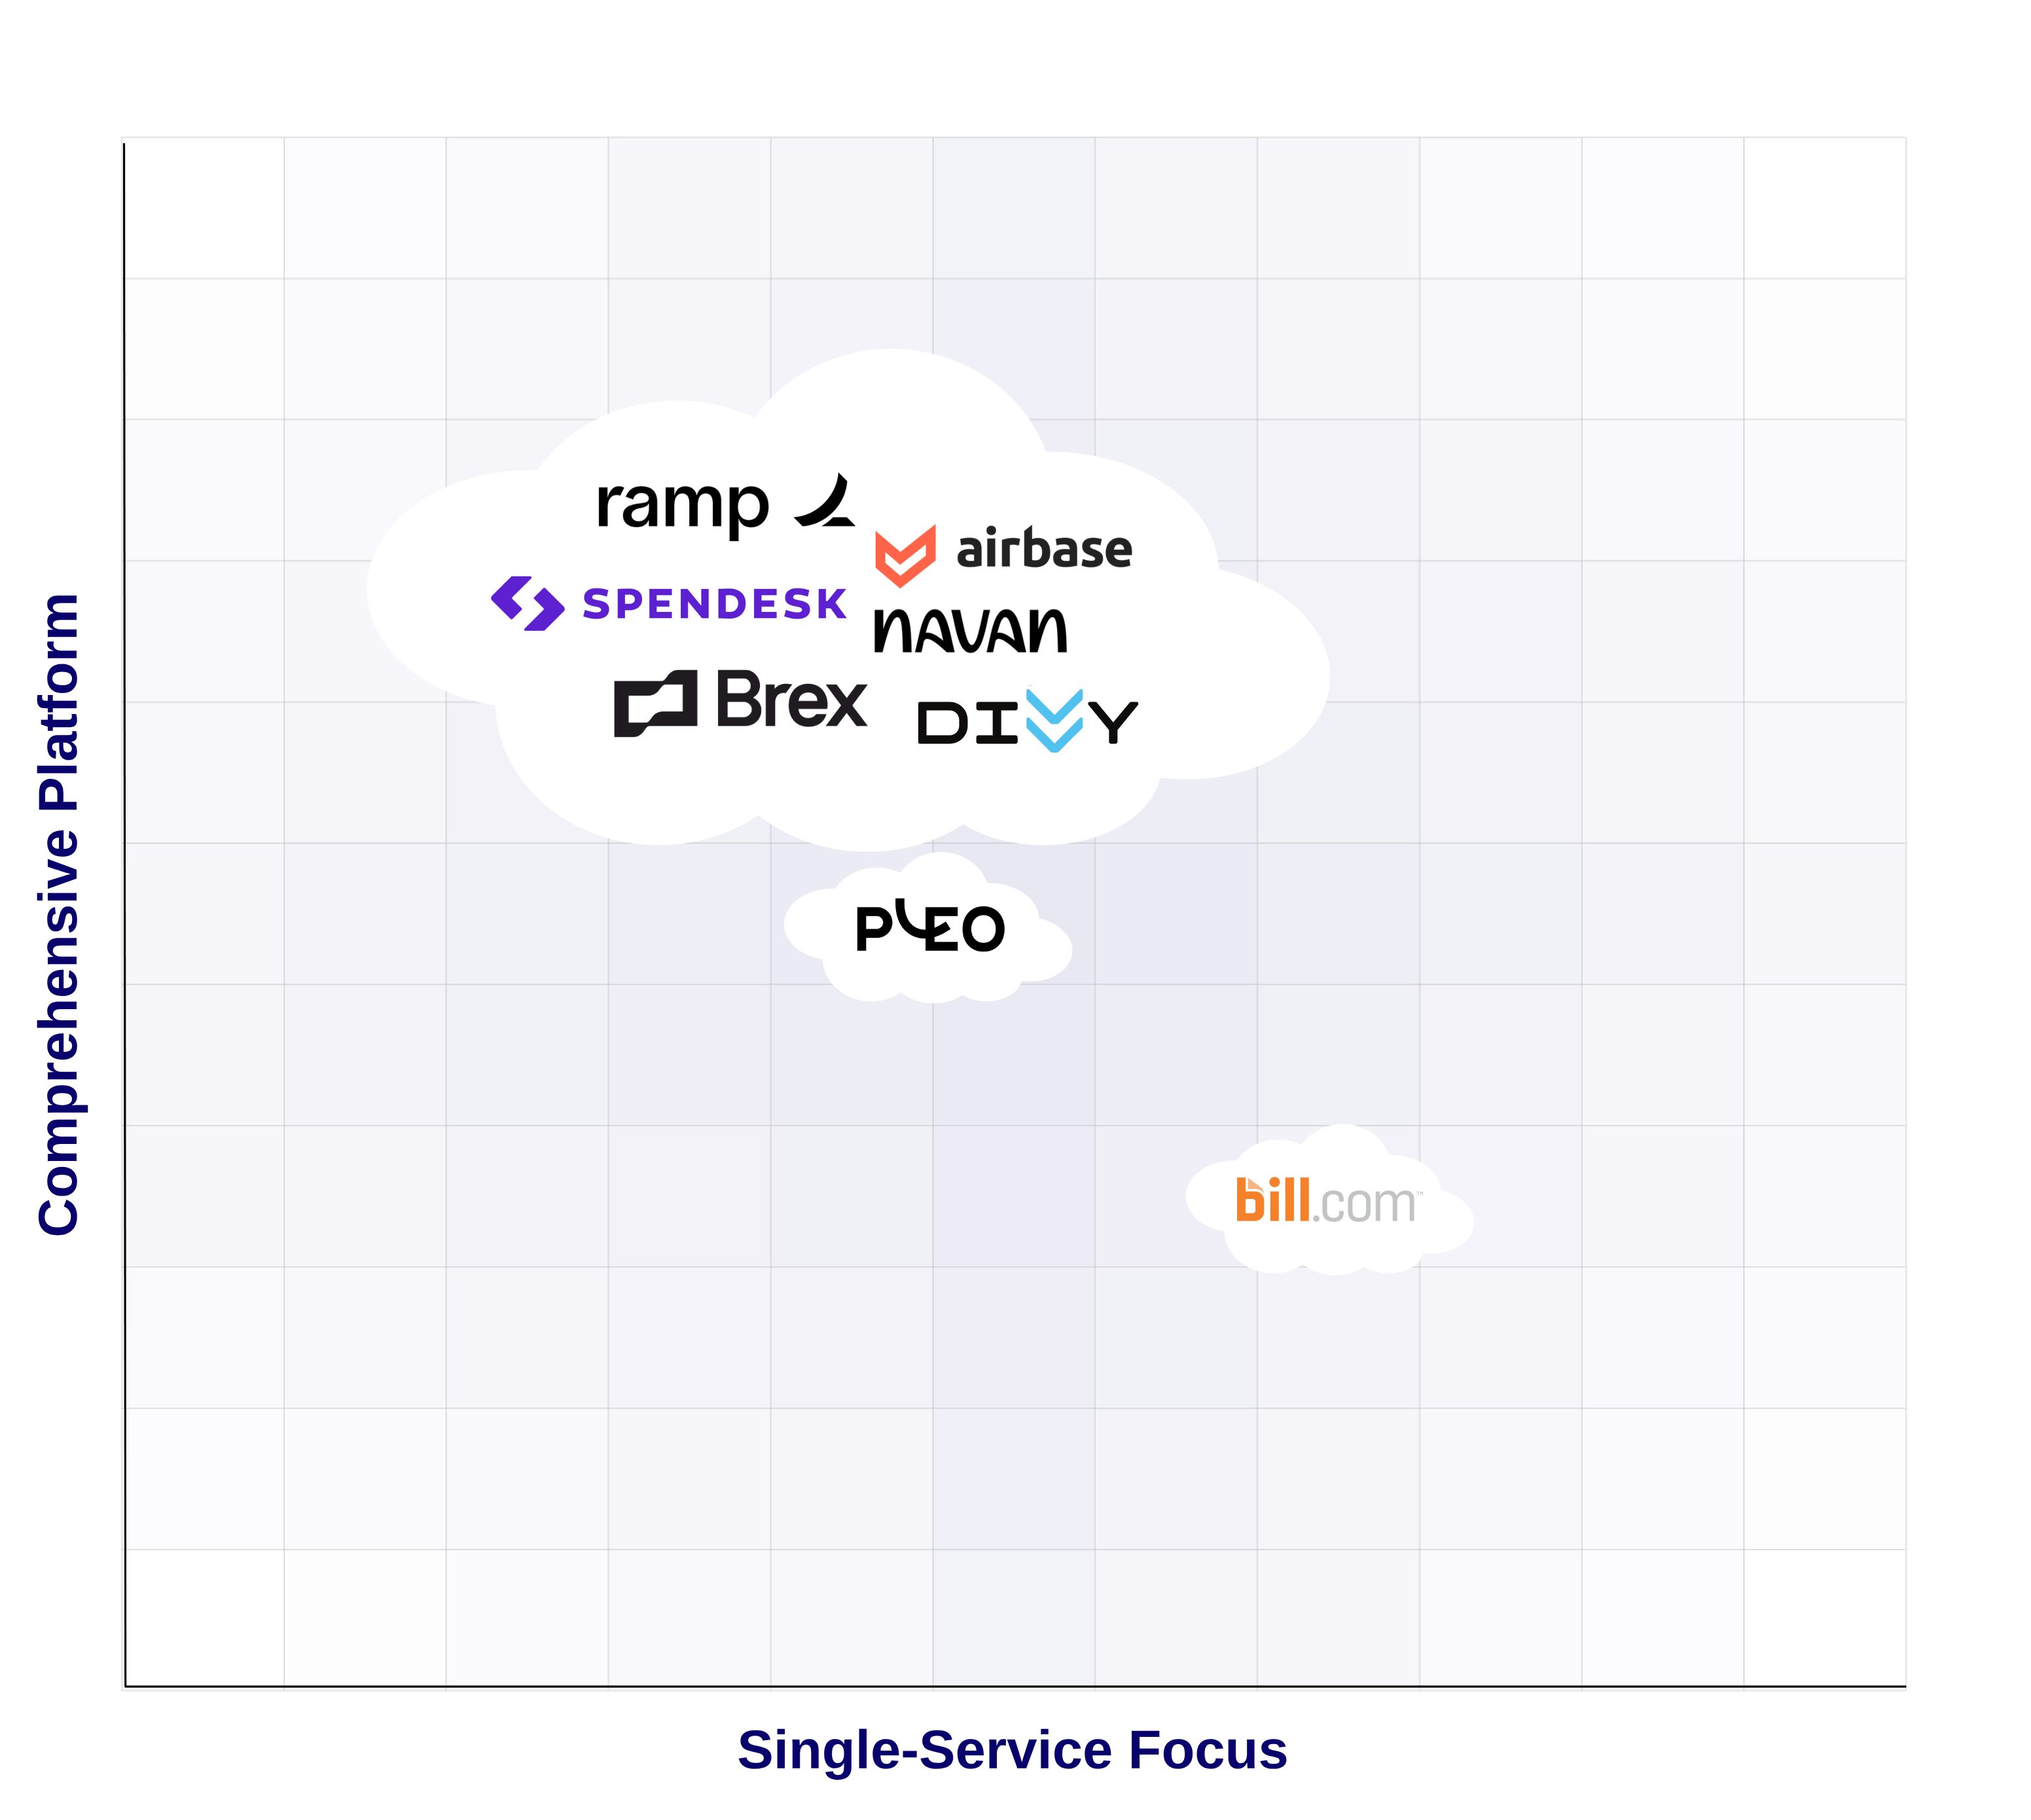
Competitive Edge
The corporate spend management software market is divided between comprehensive financial operations platforms and specialized point solutions:
<row>
<col>
- Comprehensive platforms: Ramp and Brex lead with integrated corporate cards, expense management, accounts payable automation, bill pay, and procurement software
- Specialized solutions: Bill.com focuses on accounts payable and bill payment automation with deep AP functionality
- Mid-market competitors: Airbase, Spendesk, and Divvy offer corporate card and expense management features balancing breadth with specialization
- Market trend: Growing demand for unified spend management platforms including corporate card, AP automation, and procurement software over disconnected tools
</col>
<col>
</col>
</row>
<row>
<col>
Targeted Impact
Ramp drives efficiency, cost savings, and smarter decisions by automating financial processes for businesses of all sizes
</col>
<col>
.png)
</col>
<col>
What Comes Next?
Ramp is launching stablecoin-backed corporate cards for cross-border payments, starting in Latin America and expanding globally.
</col>
</row>
<row>
<col>
.png)
</col>
<col>
Who will benefit?
Startups, small and midsize businesses, and finance teams benefit from Ramp's automated spend management and flexible corporate cards.
</col>
<col>
.png)
</col>
</row>
Ramp's Timeline
.png)
Bull and Bear Case
.png)
Prominent News
Ramp Hits $32 Billion Valuation in Latest Funding Round, November 17, 2025 - Ramp hit a $32 billion valuation in its latest funding round after raising $300 million led by Lightspeed Venture Partners, underscoring investor enthusiasm for expense‐management fintech. Click here to read more
Fintech Ramp Launches Fraud Fighting, Bill Payment AI Agents, October 7, 2025 - Fintech Ramp has launched AI agents designed to fight fraud in its bill-payment workflows, underscoring its push into advanced automation and risk-management tools. Click here to read more.
Fintech Decacorn Ramp Acquires Jolt AI to Help Its Engineers ‘Build Faster’, October 6, 2025 - Ramp has acquired the three-person team behind Jolt AI in a strategic move to boost engineer productivity and fast-track its AI dev-tooling. Click here to read more.
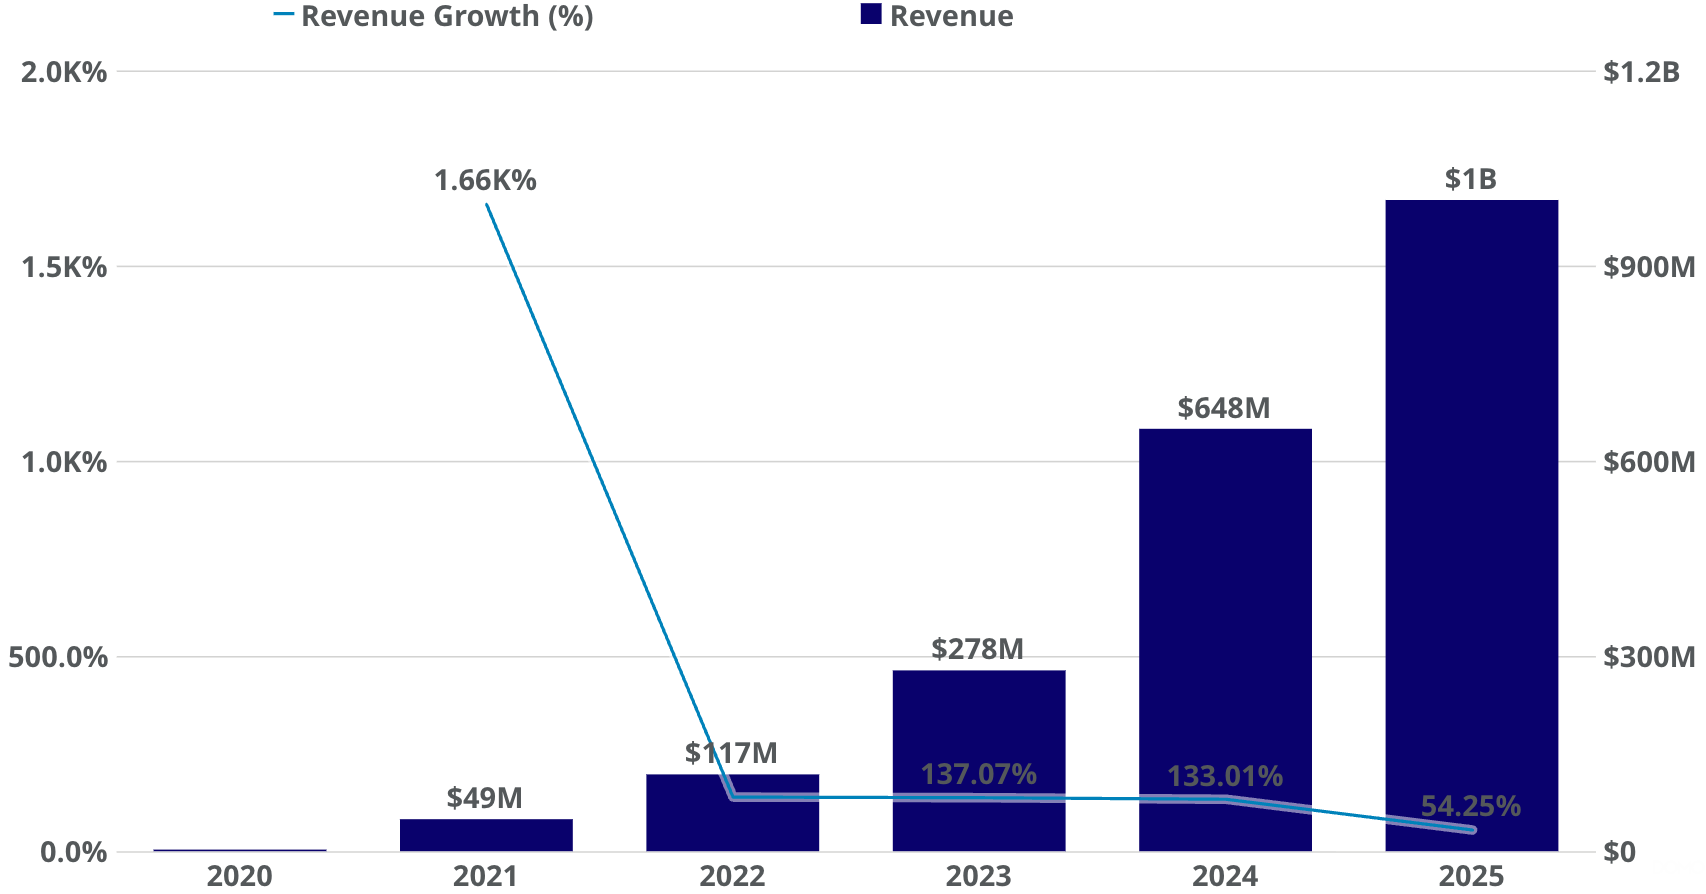
Revenue
The graph below displays the revenue and revenue growth of Ramp from 2020 to 2025
- As of October 2025, revenue is up 54.25% from $648 million in 2024
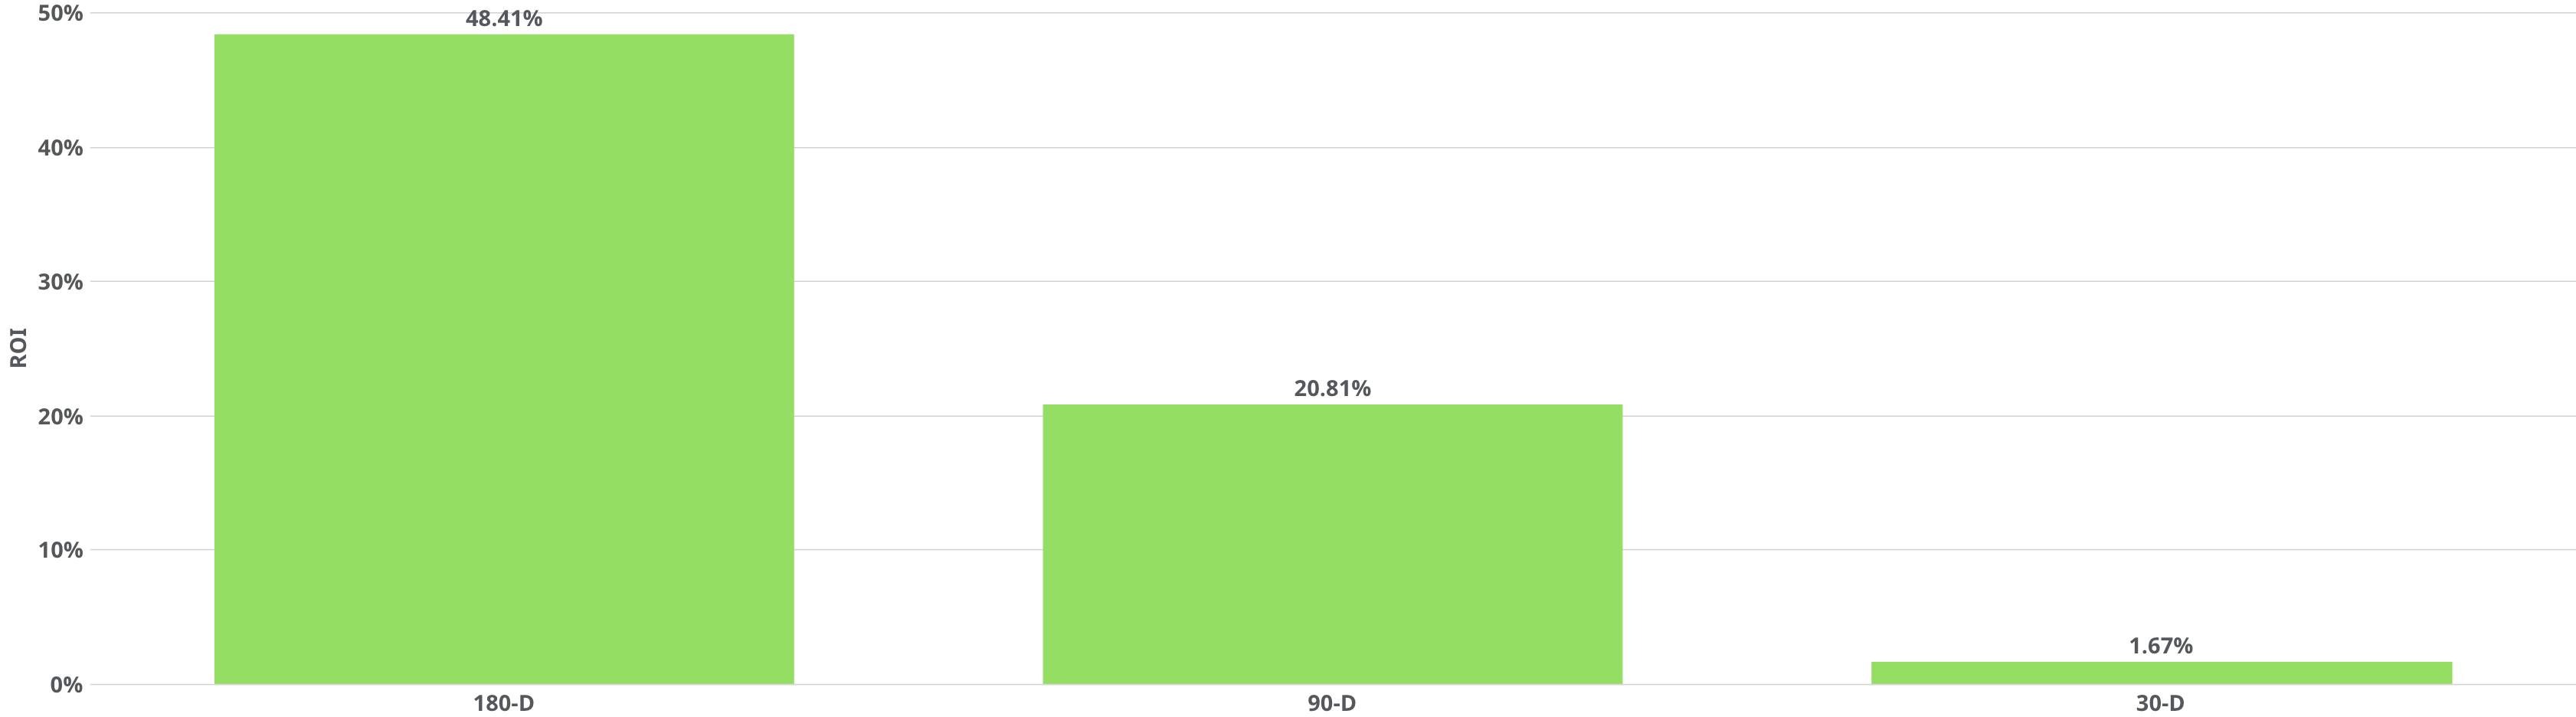
Return on Investment (ROI)
The graph below displays Ramp's ROI over the past 180, 90, and 30 days, computed as of November 17, 2025.
- 180D: ↑ +48.41% since May 22, 2025
- 90D: ↑ +20.81% since August 20, 2025
- 30D: ↑ +1.67% since October 19, 2025
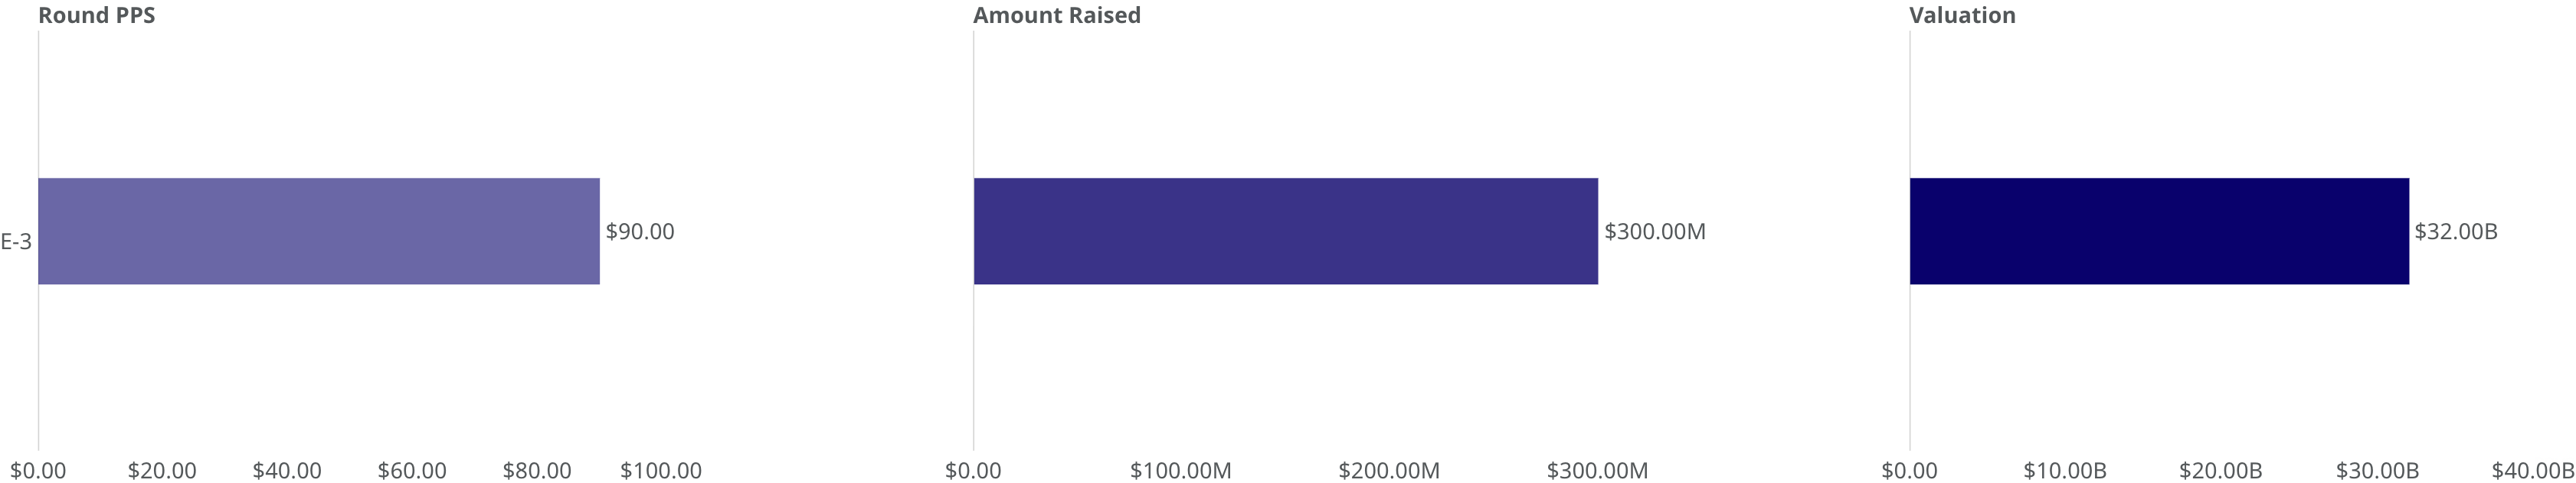
Funding Round in USD
- Primary Funding Round: Ramp raised $300 million in Series E-3 on November 17, 2025, at a $32B valuation and a share price of $90.00
- Investors: Series E-3 was led by Lightspeed Venture Partners and also saw participation from Founders Fund, D1 Capital Partners, Coatue, GIC, Avenir Growth, Thrive Capital, Sutter Hill Ventures, T. Rowe Price, Khosla Ventures, ICONIQ, Glade Brook Capital Partners, Soma Capital, Emerson Collective, 8VC, Lux Capital, Definition Capital, 137 Ventures, General Catalyst, Box Group, Kultura Capital, Pinegrove Venture Partners, Anti Fund, Stripes, Alpha Wave Global, Bessemer Venture Partners, Robinhood Ventures, 1789 Capital, Epicenter Capital, and Coral Capital.
- Secondary Market Valuation: $21.90 billion on November 17, 2025, according to PM Insights
<row>
<card>
Primary Round Valuation
<span class="date">2025-11-17</span>
<span class="value">$32.00B</span>
</card>
<card>
Secondary Market Valuation
<span class="date">2025-11-17</span>
<span class="value">$21.90B<span>
</card>
<card>
Valuation Change
<span class="date">primary → secondary</span>
<span class="value red">-31.56%<span>
</card>
</row>
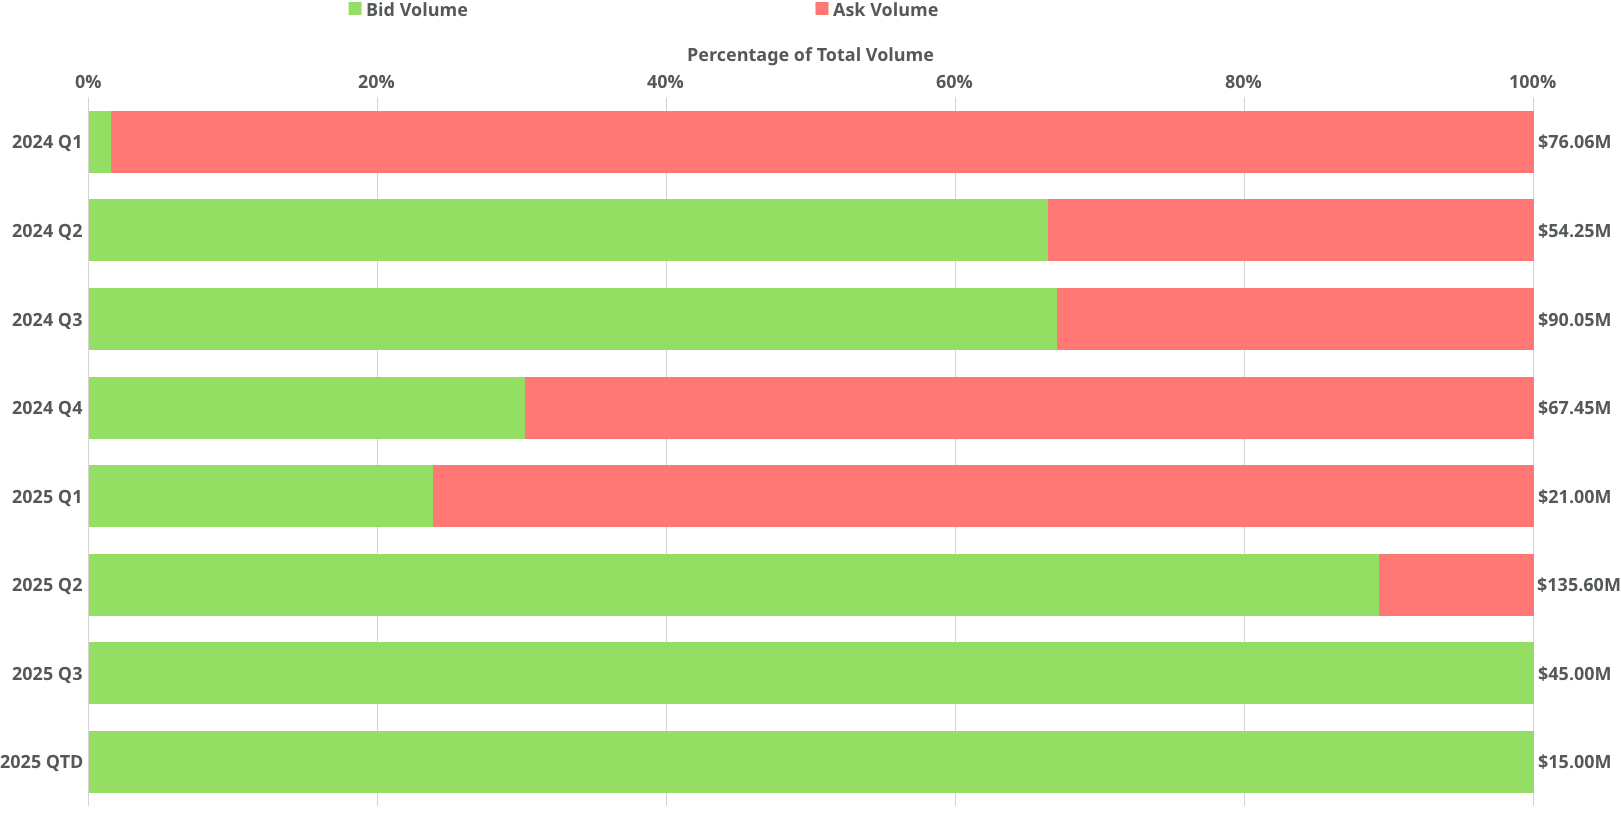
Quarterly Bid-to-Ask Volume Ratio
PM Insights presents the quarterly bid-to-ask volume ratio of Ramp from Q1 2024 to QTD 2025. The stacked bar chart below shows total quarterly bid and ask volumes alongside their relative ratios, illustrating market activity.
- Highest volume: $135.60 million in Q2 2025
- Lowest volume: $21.00 million in Q1 2025
- Largest bid-side activity: 100% of $45 million in Q3 2025
- Largest ask-side activity: 98% of $76.06 million in Q1 2024
- QTD 2025 activity: 100% of $15.00 million were bids between October 1, 2025 and November 17, 2025
Volatility of Composite Price
The volatility of the composite price is calculated based on price movements within a 90-day rolling window ending on each respective date. The graph below illustrates the trend in volatility of composite price for Ramp for a one year period from November 18, 2025 until November 17, 2025.
- Volatility began at 27.39% in early November 2024, increased slightly, and then declined sharply to 14.33% in early January 2025
- Toward the end of January, it rose quickly to a peak of 37.36%, where it stayed at elevated levels until late April before dropping to 12.62%
- It then increased to 20.66% in early June and moved lower over the following weeks, reaching a low of 6.77% in early September
- Shortly afterward, volatility rose sharply to 35.66% and ended the period at 35.55%

Ramp's Private Comparables
PM Insights highlights four private companies, all active as of November 17, 2025, that are close competitors of Ramp. These companies either offer all-in-one spend-management platforms or specialize in financial infrastructure for payments, payroll, and global workforce operations.
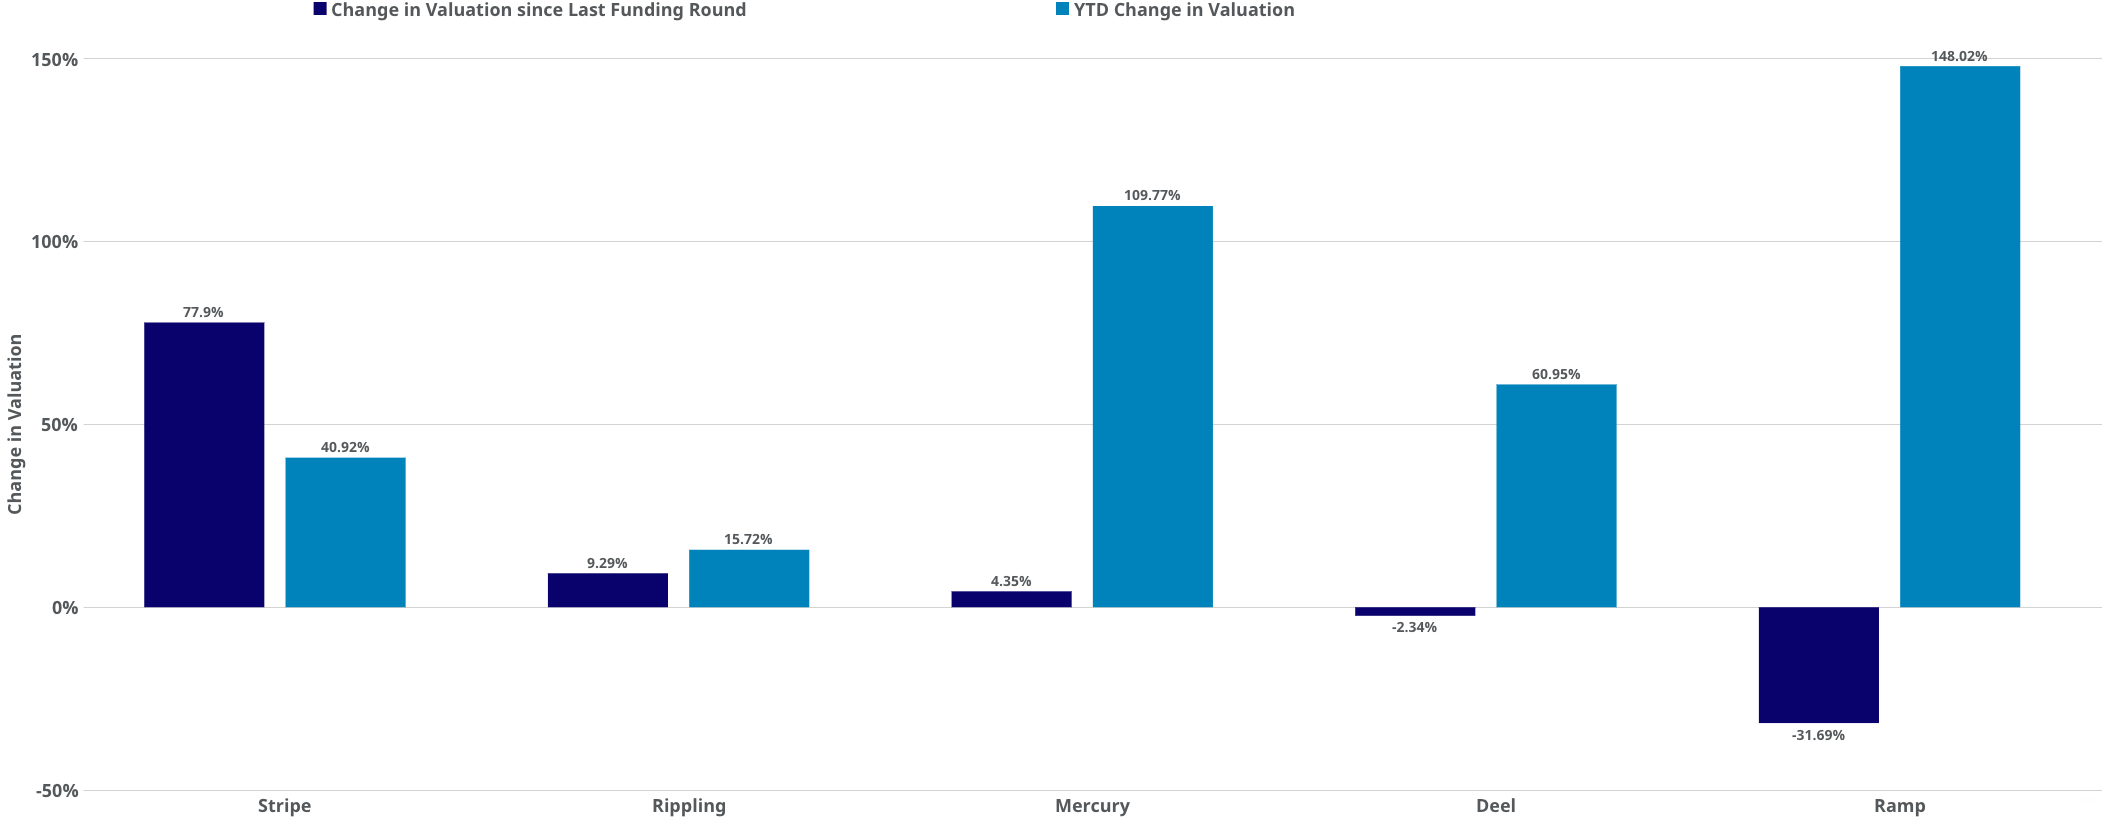
Change in Valuation
PM Insights uses composite prices based on institutional-sized broker contributions within the last 90 days to compute implied valuations. The current implied valuations reported below were computed as of November 17, 2025, and are compared to each company's latest funding round valuation and valuation on December 31, 2024:
- Stripe's current implied valuation is $124.53B, a 77.9% increase from its latest valuation of $70.0B. Stripe's implied valuation was $88.7B on December 31, 2024
- Rippling's current implied valuation is $18.36B, a 9.29% increase from its latest valuation of $16.8B. Rippling's implied valuation was $15.9B on December 31, 2024
- Mercury's current implied valuation is $3.65B, a 4.35% increase from its latest valuation of $3.5B. Mercury's implied valuation was $1.74B on December 31, 2024
- Deel's current implied valuation is $16.89B, a 2.34% decrease from its latest valuation of $17.3B. Deel's implied valuation was $10.5B on December 31, 2024
- Ramp's current implied valuation is $21.86B, a 31.69% decrease from its latest valuation of $32.0B. Ramp's implied valuation was $8.83B on December 31, 2024
90D Bid and Ask Volume Ratio
The stacked bar chart below illustrates the bid and ask volume ratios for the period from August 20, 2025, to November 17, 2025, showing only companies with at least 3 contributions.
- Highest volume: Stripe, $1.19 billion
- Lowest volume and largest bid-side activity: Ramp, 100% of $15.00 million
- Largest ask-side activity: Mercury, 59% of $18.15 million

Change in Composite Price
The bar chart below illustrates the 90-day change in composite prices for the period from August 20, 2025, to November 17, 2025.
- Strongest gain: Deel's composite price rose by +28.99% from $29.46 to $38.01
- Lowest gain: Mercury's composite price was up +2.04% from $13.23 to $13.50
- Ramp also showed strong momentum, with its composite price rising 20.81% from $50.88 to $61.48

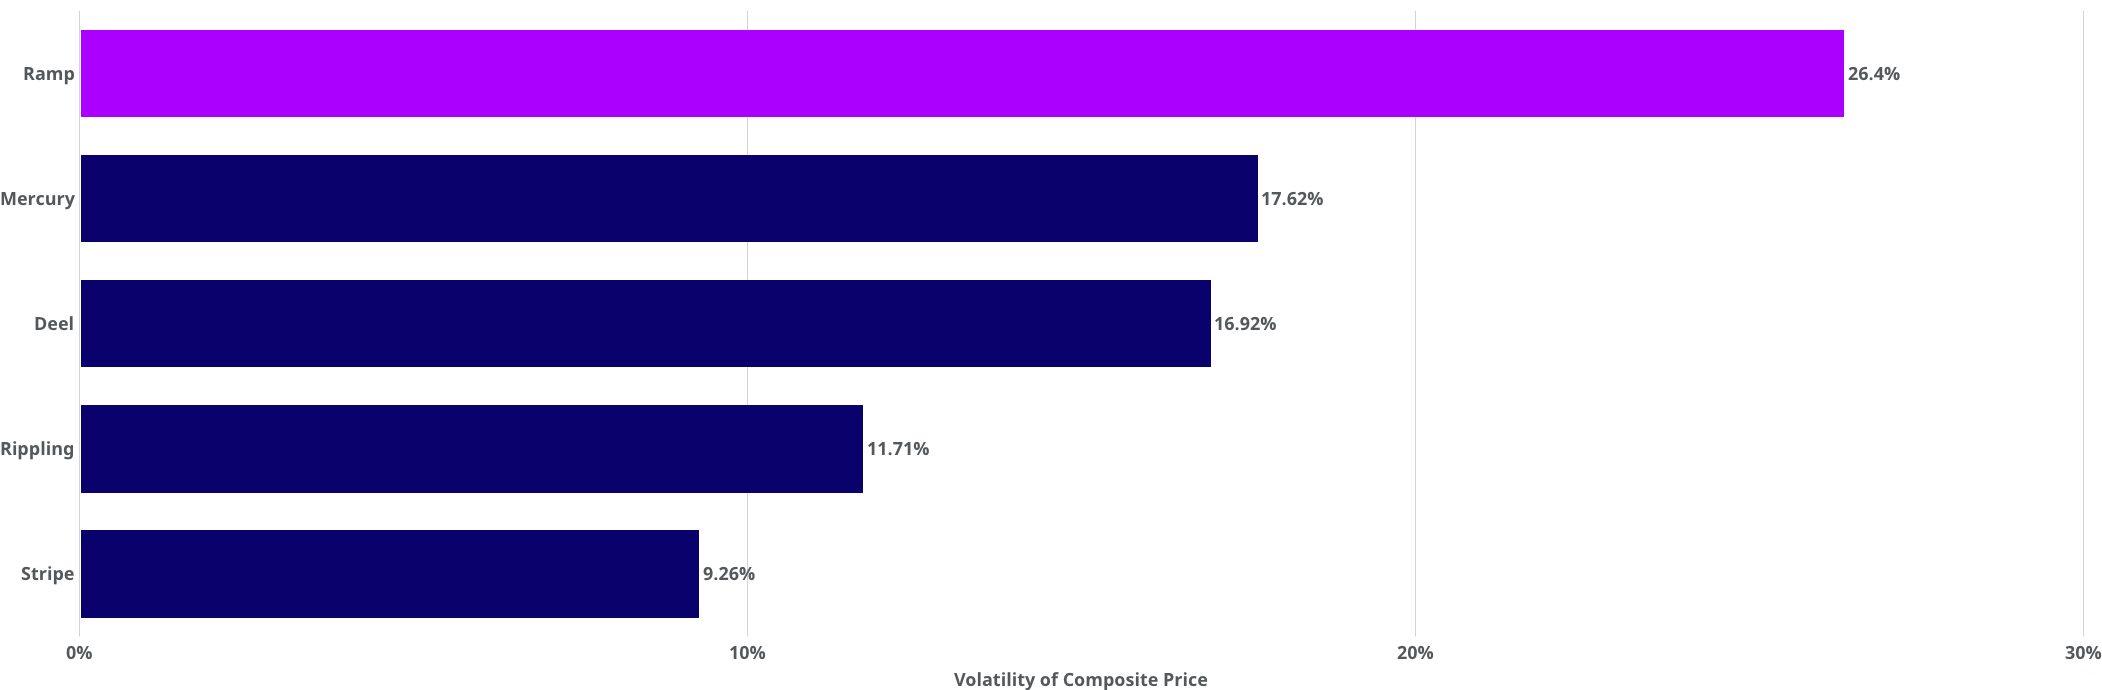
YTD Average Volatility of Composite Price
The volatility of the composite price is calculated based on price movements within a 90-day rolling window ending on that date. The bar chart below displays the mean volatility from January 1, 2025 until November 17, 2025.
.jpg)
.jpg)

.jpg)
.jpg)
.jpg)
.jpg)
.jpg)
.jpg)