%201.png)
VC Secondaries Market Report Q2 2025 | PM Insights Quarterly Update
PM Insights Q2 2025 in Review
July 1, 2025
Q2 2025 Venture Market Insights
<row>
<col>
Slow start to Q2, but IPOs drive rebound in May & June
Tariffs, policy uncertainty, and public market turbulence led to a drop in private company secondaries in March and April. However, a number of strong performing IPOs have helped jolt the market back to life.
More listings and M&A expected ahead
Trading activity is still concentrated across the largest private names, however PM Insights' data reflects a revival across second tier companies has begun. Particularly notable names are likely to overlap as IPO candidates for the remainder of 2025. The successed of CoreWeave, Circle and Chime has re-ignited interest in capturing value just ahead of the expected public listing.
Overall 2025 returns still positive
While the policy and economic uncertainty that led to a contraction in activity in late Q1 / early Q2 has also put a dampener on returns, there has nevertheless been positive momentum building once again with many buyers anticipating a return to stability.
</col>
<col>
PM Insights Indication Volumes by Size Bucket

(*) PM Insights does not use contributions with volume less than $1M in our composite calculation.
PM Insights is the leading market data provider for private company shares- delivering unmatched clarity, precision, and independence. Built exclusively for institutions requiring the most accurate, objective, and actionable data, research, and market insights.
</col>
</row>
Private & Public Market ROI
<row>
<col>
Private vs. Public YTD ROI

</col>
<col>
Private Sector YTD ROI
.png)
</col>
</row>
The PM50 Growth tracks the performance of the 50 most active private names observed in the secondary market. It is an equal-weighted index, rebalanced on a monthly basis.
This rebalancing of constituents over time gives way for more active names to participate in what we observe as "market performance," and in a more appropriate manner than static selections and weightings criteria.

Private Market: Sector Level
|| Sector-level analysis as of June 30, 2025.
PM50 Growth index is up 6.7% and volatility of its ROI is 30.7%.
Cloud & Infra sector has the highest ROI at 16.4% and highest volatility of ROI at 88.5%.
Analytics sector has the lowest ROI at -9.3% and an average volatility of ROI at 25.5%.
PM50 Growth Quarterly ROI
Private market ROI is on the rise.
PM50 Growth data point to a slowdown in the private market's rebound with a 6.7% ROI in Q2 2025, well below Q1's 23.5% Return, though still maintaining the positive momentum since Q3 2023.
As with broader capital markets, growth was concentrated in the latter part of the quarter, with the economic uncertainty in March and April weighing down returns across all corners of capital markets.

Note that PM Insights added several brokers with substantial historical datasets, resulting in an update of the entire historical data. This caused changes to past ROI figures, although the overall trend remains largely unchanged.
Q2 Sector ROI
Mixed results across PM Insights active indices during Q2 2025
A significant number of sectors were in the red in Q2, in part due to the impact of the political and economic turmoil eventually impacting private stocks, while investors chased higher potential returns in other asset classes.
On the positive side, the returns for hardware, cloud and infrastructure focused sectors, especially those with AI related applications saw significant positive returns, in part driven by the strong returns of CoreWeave.

Quarterly Sector Volatility
Stability returns in Q2
ROI volatility is calculated as the average ROI movement over the 90 days prior to June 30, 2025.
With the significant gains in Q1 from massive AI rounds mostly behind us (at least for the moment), most volatility levels have come down in Q2.
The improvement in investor sentiment has also helped, with more trading and more overall confidence appearing to return to the space post the dislocations seen in late Q1 / early Q2 of this year.
This is also evident through noticeable spread tightening across sectors vs the previous quarter, as shown in the charts on the following page.

6M Average Bid & Ask Spread per Sector

Median Revenue Multiple per Sector
Revenue multiples for the most active sector benchmarks continue on their upwards trajectory
Despite the bumpy end to Q1 the overall direction has remained very much up and to the right for revenue multiples in Q2 of 2025. The initial tumult from the tariffs and other policy uncertainty has receded, and the positive momentum has returned to all major active sectors.
The strong IPO debuts, mentioned above, were also seen as a major driver of positive sentiment and thus demand across sectors with AI still leading the way, and most seeing accelerating trends.

Note: The reset spikes in the data are typically due to new revenue figures for each of the 12-month annual figures
Activity
Q2'25 activity rebounds post late Q1 drop for an above average showing.
Investor interest was quick to return in May and June of 2025, buoyed by the strong post IPO performance of CoreWeave, Circle and Chime among others.
Unfazed by the continued prospect of a global economic slowdown due to ongoing trade tensions, investors were looking on the bright side as many came back to the secondary markets seeking to capture potential pre-IPO gains.

Mean Volume per Indication Type
Overall, mean volumes remained more or less flat from the previous quarter though a significant difference emerged between bid and offer average volumes.
Bid volumes, boosted by demand for pre-IPO potential gains saw average monthly volumes grow throughout the quarter approaching $15M average lot size.
On the offer side, on the other hand, average lot size shrank throughout the quarter, dropping well below $10M by June.
This likely also contributed to mean completed trade volume dropping significantly towards the end of this quarter.

Quarterly Bid & Ask Volume
Overall volumes and bid-offer ratio returns to longer-term averages seen through 2024.
The overall volume for the quarter grew to levels similar to those observed in 2024. At the same time offers to bid volume ratio has also returned to levels seen last year, with offers well over 60% of total observed volume in the secondary space.

Top 10 Based on Bid or Ask Volume in Q2 2025
<row>
<col>
.png)
ByteDance: ByteDance attracted substantial market attention, as shown by the high levels of both bid and ask volume.
</col>
<col>
.png)
SpaceX: In Q2, SpaceX once again led sell-side volumes, extending its dominance from Q1 2025.
</col>
</row>
Top 10 Companies Based on Overall Volume
Strong Market Activity Centered Around ByteDance and SpaceX in Q2.
Investor attention in Q2 2025 remained heavily focused on a few dominant players. ByteDance led the pack with $4.5B in secondary volume, followed by SpaceX at $3.5B. xAI recorded 1.4B, while Stripe followed closely at 1.3B, maintaining their position among the most actively traded private companies. The concentration trend observed in Q1 deepened further, with just four companies again exceeding the $1B threshold, underscoring the growing liquidity gap between top-tier names and the broader market.
<row>
<col>
.png)
</col>
<col>
.png)
</col>
</row>
Top 10 Based on Institutional Contributions During the End of Q2 2025
Data as of June 30, 2025.

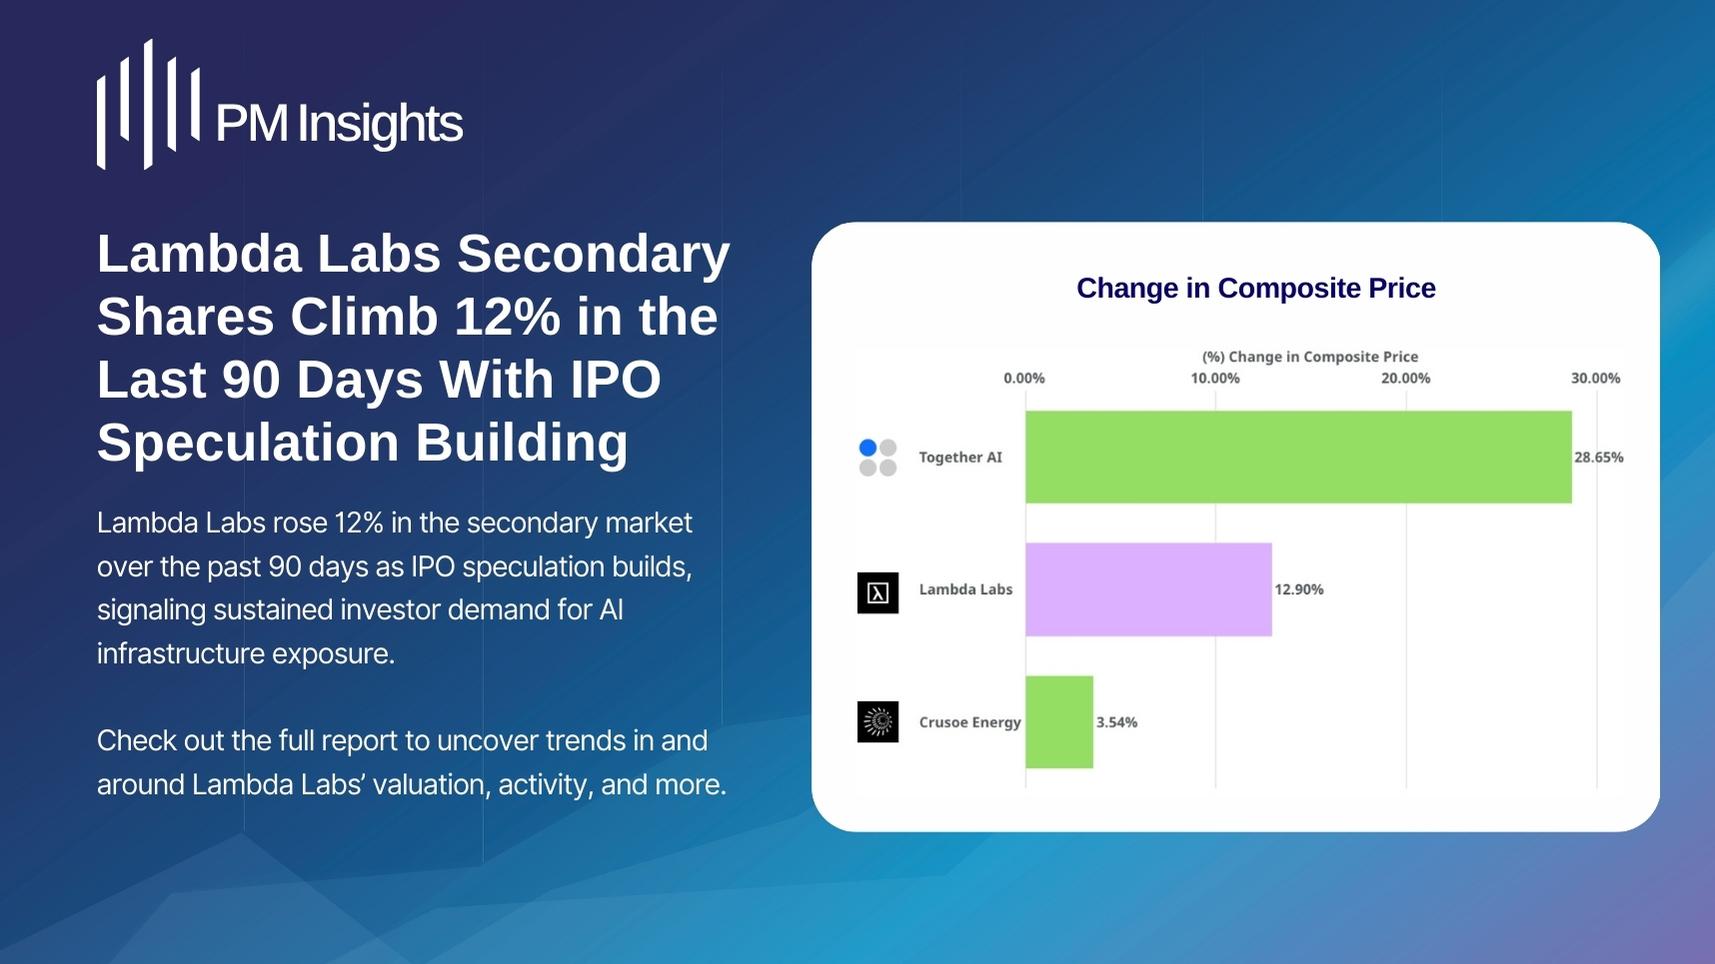
Quarterly Percentage Change in Share Price
Quantum leap from PsiQuantum
While AI hype has continued to capture investor attention and capital, there was surge from a different, if related, area - quantum computing. PsiQuantum saw the biggest jump, up >70%, in price per share with a funding round in late May. OpenAI, Scale.ai and Vercel were other notable gainers, notching well over 30% increases.
On the other hand, investors appear to be losing faith in Artic Wolf and Postman, the more established players in security and SaaS infrastructure, both dropping about 30%.

Proportion of Change in Valuation
91% of companies in PM Insights’ universe are trading higher than the valuation they achieved in the rounds prior.
Also, there was an improvement in % of companies traded at a discount compared to their most recent round, while it was still a majority (57% vs 43% that trade at a premium) it was well below the 65% seen trading at a discount vs most recent round in Q1'25. So while secondary market still generally trades below primary valuations, the number of names where the opposite is true appears to be growing steadily.

Average Change in Valuation
<row>
<col>
.png)
A significant dichotomy emerged between valuations in recent rounds compared to previous ones, with some companies achieving substantially higher valuations while others experienced notable down rounds. Timing and sector -especially AI - being critical factors.
</col>
<col>
However, upward swings were less pronounced when comparing PM Insights' current implied valuations to recent primary rounds, while valuation declines for some were even steeper, with Q2 upswings being more muted, vs those seen in Q1.
.png)
</col>
</row>
PM Insights Price vs Mutual Fund Price
Historically, mutual funds have marked their positions in late-stage private companies at or above the most recent primary funding round valuation.
As markets cooled, many mutual funds were slow to reflect the broader sentiment, resulting in PM Insights' valuations (based on institutional secondary market activity) increasingly falling below mutual fund marks for those companies.
However, this trend seems to have shifted in the second half of 2024 (noting that filings are usually delayed by a quarter), reflecting a broader market recovery and better conditions, with mutual fund valuations now more closely aligned with secondary market prices.

.jpg)
.jpg)
.jpg)
.jpg)
.jpg)
.jpg)
.jpg)
.jpg)