%201.png)
Automation Sector's Impact on VC Trends
Institutional secondary market-driven data insights covering a universe of private venture-backed companies.
July 29, 2025
PM Insights provides a detailed analysis of sector-level trends in ROI, volatility, revenue multiples, liquidity metrics and company-specific activity over specific periods of time.
This report highlights the changes in performance across several sectors, showing notable shifts in investor sentiment and trading behavior. Its focus on the Automation sector reflects the growing importance in technologies that reduce the need for human input in repetitive or rule-based tasks.
Automation sector covers a broad spectrum, ranging from industrial robots on factory floors to AI-powered tools that accelerate software development. In particular, there is a growing focus on intelligent software automation, such as in AI-native coding platforms, helping developers to write, debug, and ship code significantly faster.
This surge is being driven by the rapid AI advancement, resulting in strong investor interest and accelerated adoption across both traditional industries and newer digital companies.
Key Takeaways
- Most sectors delivered positive returns during the 90-day period between April 30 to July 28, 2025, indicating generally favorable market conditions. Specifically, 16 out of 19 of these PM Insights’ actively tracked indices had a positive ROI during this period. Cloud & Infra sector recorded the highest ROI at 16.89%, while Analytics sector had the lowest at -9.44%.
- AI sector exhibited the highest level of volatility of ROI at 81.24%, reflecting substantial price swings and investor uncertainty. Marketing sector showed the lowest volatility at just 3.26%, indicating consistent performance and minimal price disruption.
- Defense sector achieved a mean revenue multiple of 129.30x, reflecting notably elevated market valuations. Banking sector recorded the lowest value of 12.21x, indicating a more conservative valuation relative to revenue.
- Automation sector showed a strong sell-side skew, with 87% of its $4.09B volume in asks.
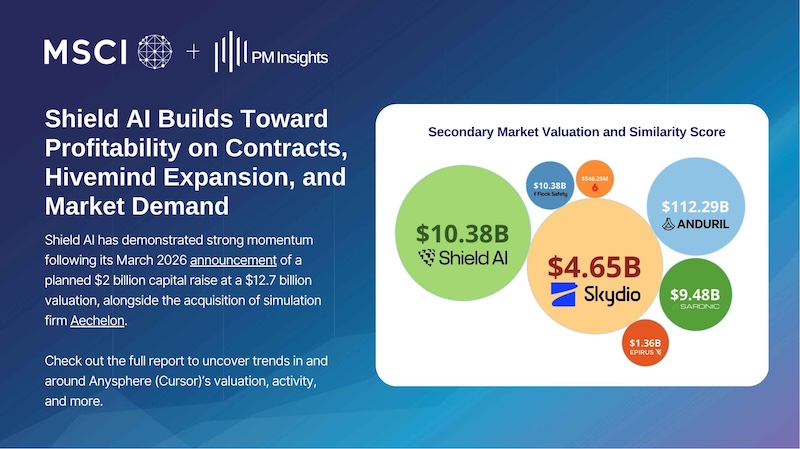
- Within Automation sector, Anysphere (Cursor) surged with a remarkable +93.39% gain in composite price, signaling strong investor interest and momentum.

Return On Investment (ROI) Private & Public
|| ROI from December 31, 2024 until July 28, 2025.
.png)
The PM50 Growth tracks the performance of the 50 most active private names observed in the secondary market. It is an equal-weighted index, rebalanced on a monthly basis.
This rebalancing of constituents over time gives way for more active names to participate in what we observe as "market performance," and in a more appropriate manner than static selections and weightings criteria.
Private Market: Sector Level
|| Sector-level analysis as of July 28, 2025.
90-Day ROI
Sector-level ROI
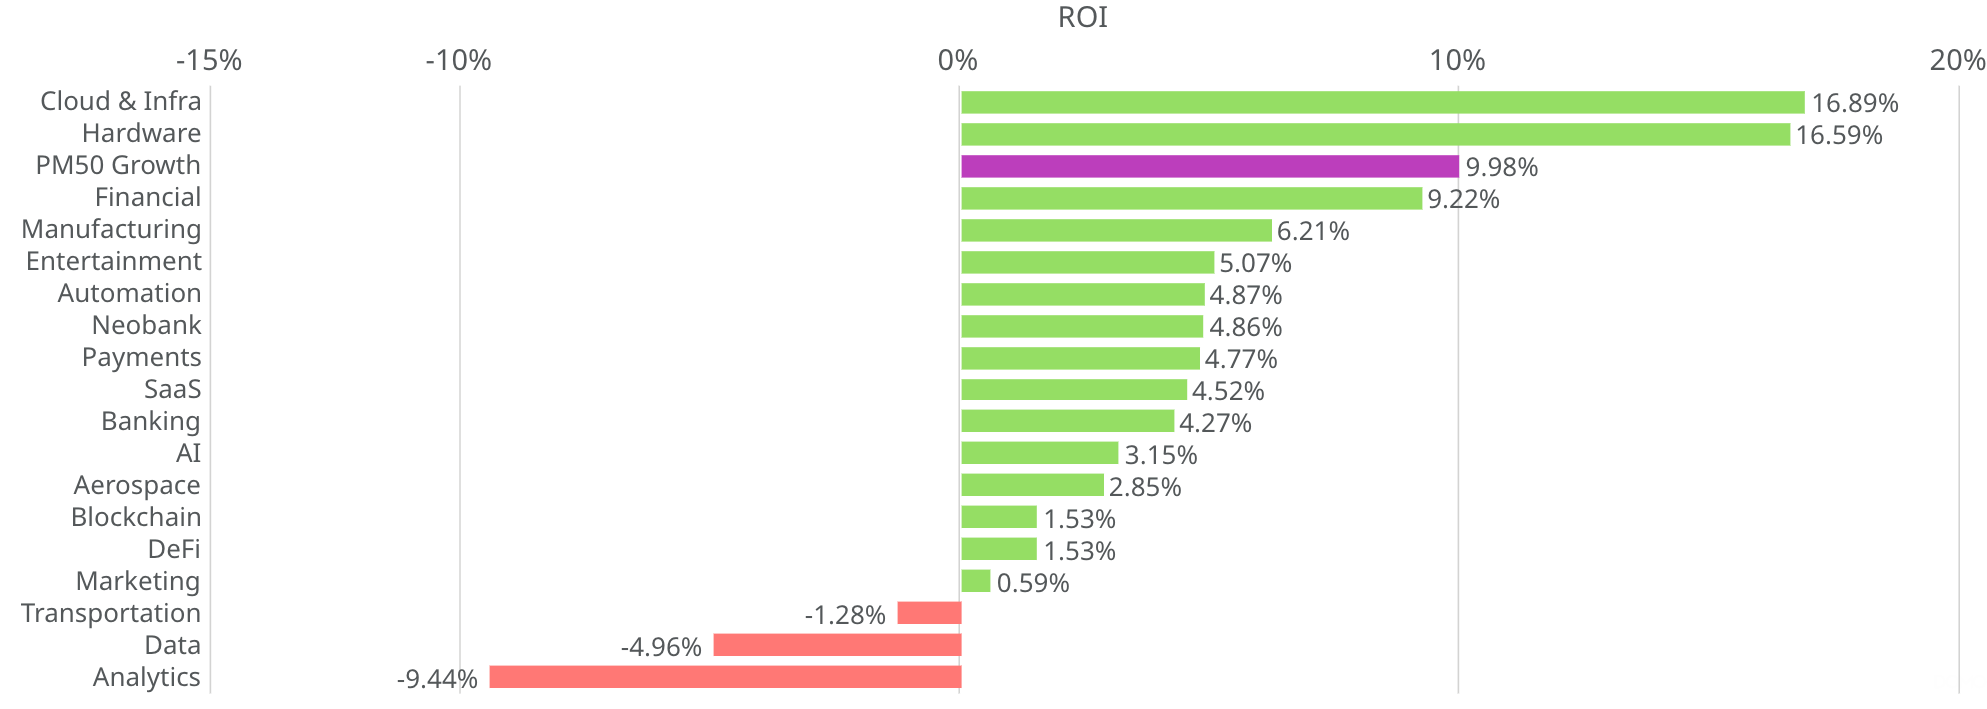
The graph below displays the 90-day ROI, broken down by PM Insights’ actively tracked sectors, covering the period from April 30 to July 28, 2025.
- Cloud & Infrastructure sector led all sectors with a 16.89% gain, followed closely by Hardware sector at 16.59%
- PM50 Growth index also performed strongly, with an increase of 9.98%
- Automation sector had a moderate increase in ROI at 4.87%
- Analytics sector experienced the sharpest ROI decline of -9.44%
Automation Sector's ROI Trend
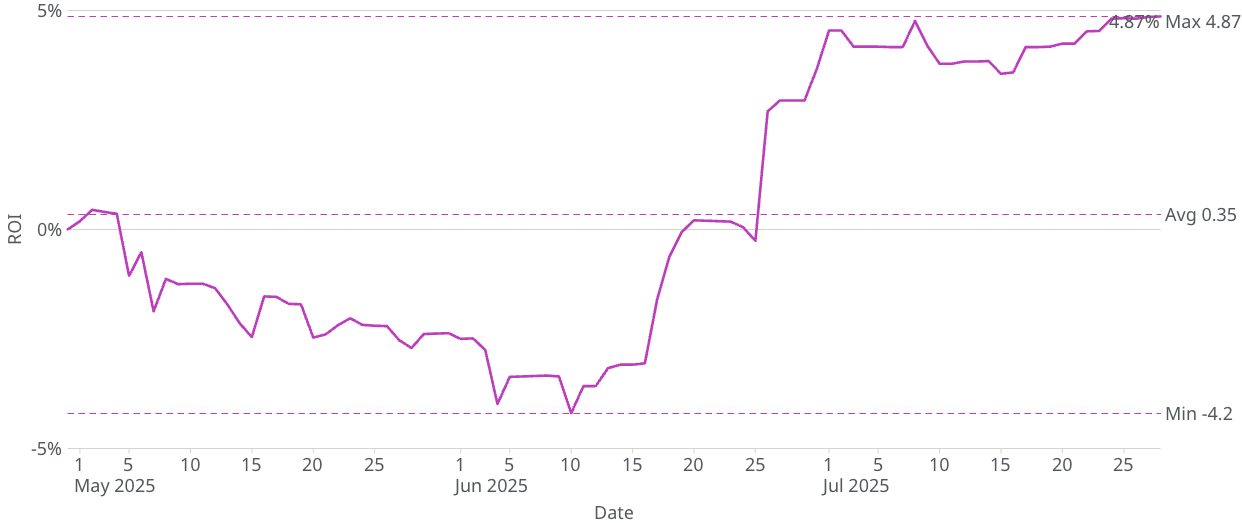
This chart provides a comprehensive overview of the Automation sector’s performance over the 90-day period spanning between April 30 and July 28, 2025.
- Automation sector’s ROI hit the lowest point of -4.20% on June 10, 2025
- ROI rapidly improved, reaching a value of 4.77% on July 8, 2025
- ROI stabilized, maintaining a close level to 4.00% for the remainder of the observed period
- Peak ROI was recorded on July 28, 2025, at 4.87%
Volatility of ROI
Sector-level Volatility
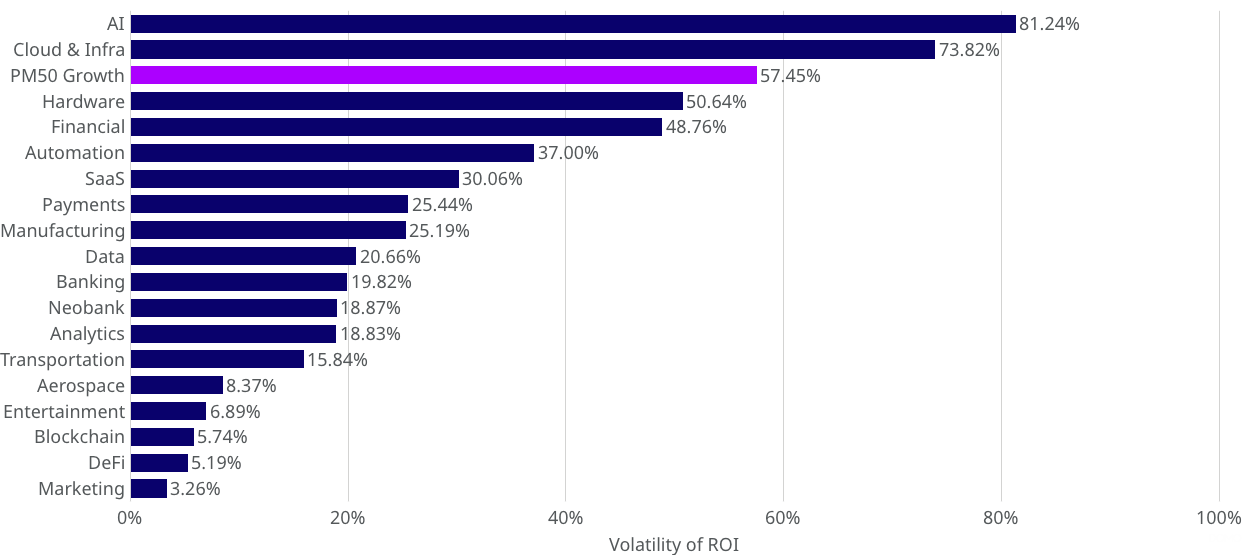
The graph shows the volatility of 90-day ROI across various sectors between April 30 and July 28, 2025. It captures fluctuations in ROI during this period as an indicator of price movement and overall market uncertainty within each sector.
- AI sector exhibited the highest level of volatility at 81.24%, reflecting substantial price swings and investor uncertainty
- PM50 Growth index also experienced significant volatility, with an ROI fluctuation of 57.45%
- Automation sector's ROI was moderately volatile at 37.00%
- Marketing sector showed the lowest volatility at just 3.26%, indicating consistent performance and minimal price disruption
Automation Sector's Volatility Trend
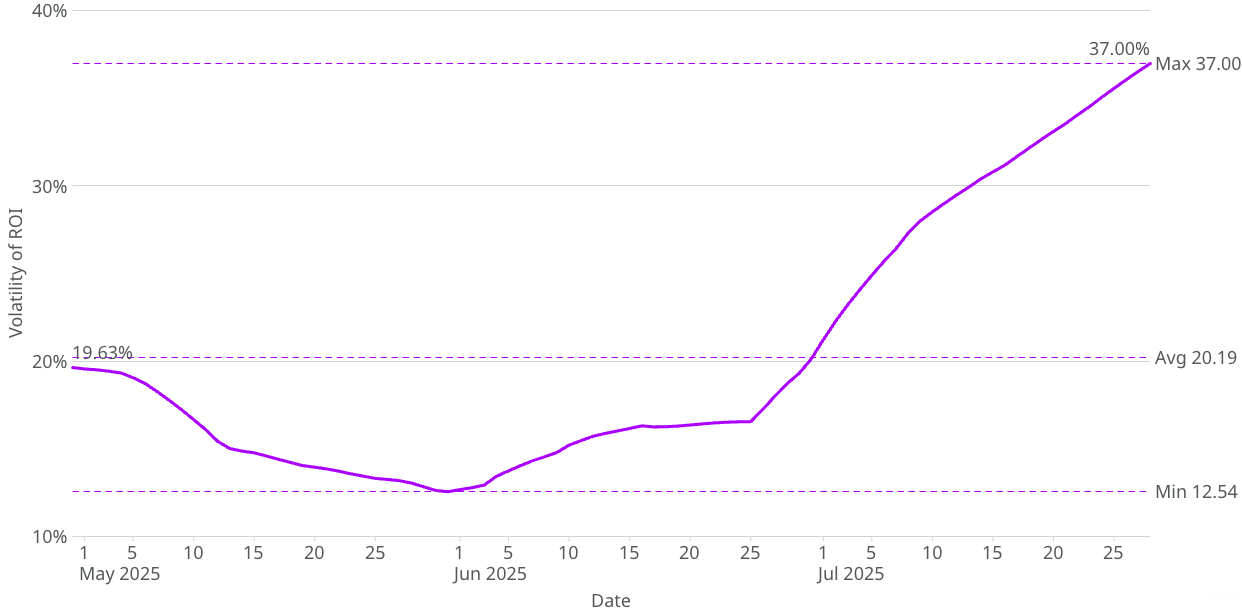
The graph illustrates the trend in volatility of ROI for the Automation sector, over the 90-day period between April 30 and July 28, 2025.
- Automation sector’s volatility of ROI experienced a steady decline in the early stages of the observed timeframe, reaching the lowest point on May 31 of 12.54%
- Volatility increased significantly reaching a peak value of 37.00% on July 28, 2025
Revenue Multiple
Revenue multiple is calculated by dividing valuation by revenue.
Sector-level Revenue Multiple
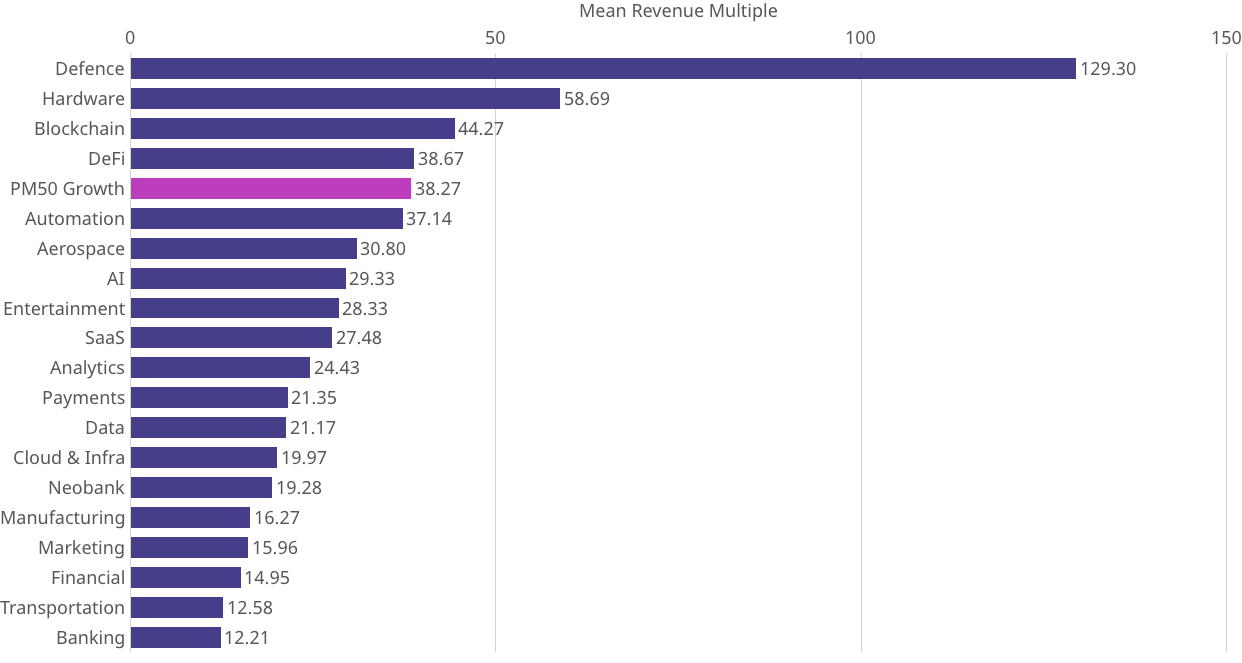
The graph below outlines the mean revenue multiple broken down by sector as of July 28, 2025.
- Defense sector achieved the highest mean revenue multiple of 129.30x
- Hardware sector followed with a mean revenue multiple of 58.69x
- PM50 Growth index recorded a moderate mean revenue multiple value of 38.27x followed by Automation sector at 37.14x
- Banking sector recorded the lowest value of 12.21x
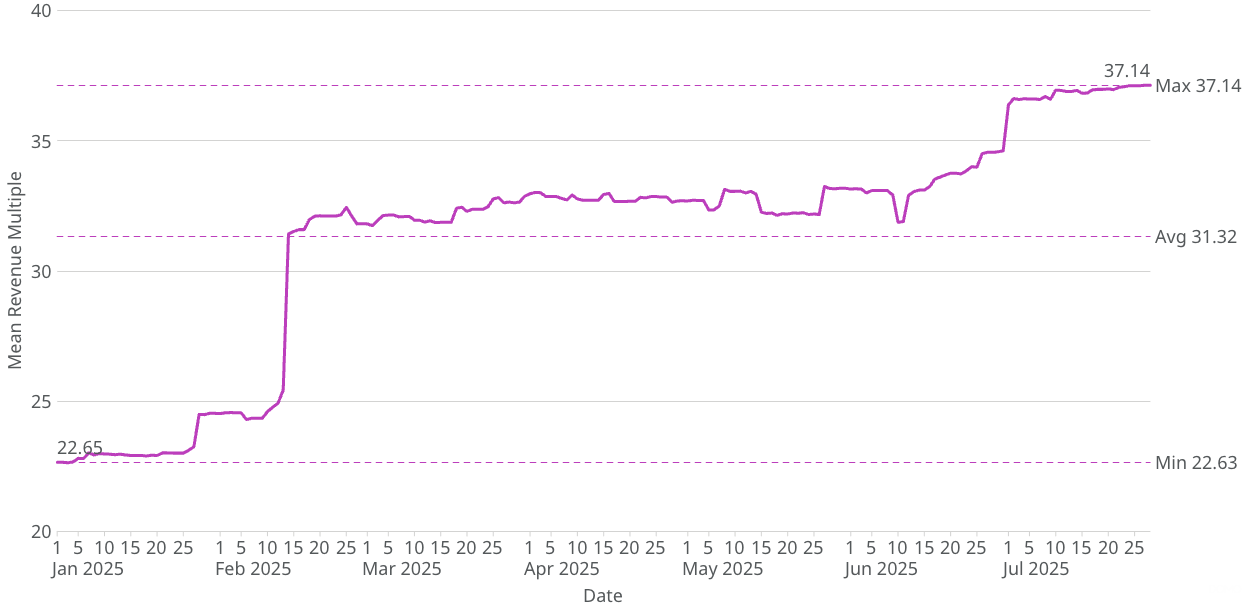
Automation Sector's Revenue Multiple Trend
This graph shows the trend of the mean revenue multiple over the period between January 1 and July 28, 2025.
- Mean revenue multiple remained overall steady until reaching a large jump of 6x between February 13 to February 14, 2025
- Trend remained steady around 32x between mid-February and mid-June
- Gradual increase from June 12, 2025 until peak mean revenue multiple value of 37.14x
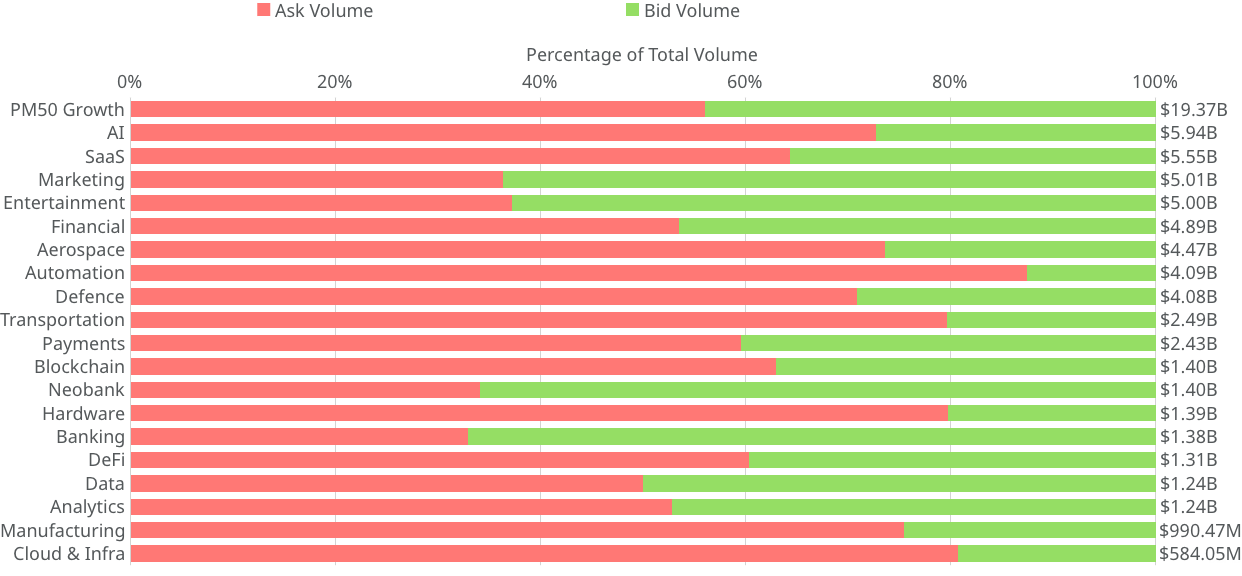
90D Bid and Ask Volume Ratio
The stacked bar chart below highlights total bid and ask volumes, along with their ratios, across sectors for selected companies with notable activity during the time period between April 30, 2025 and July 28, 2025.
- Banking sector saw the highest concentration of buy-side interest, with 67% of its $1.38 billion in volume coming from bids
- Automation sector experienced a pronounced sell-side skew, with asks comprising 87% of its $4.09 billion total volume
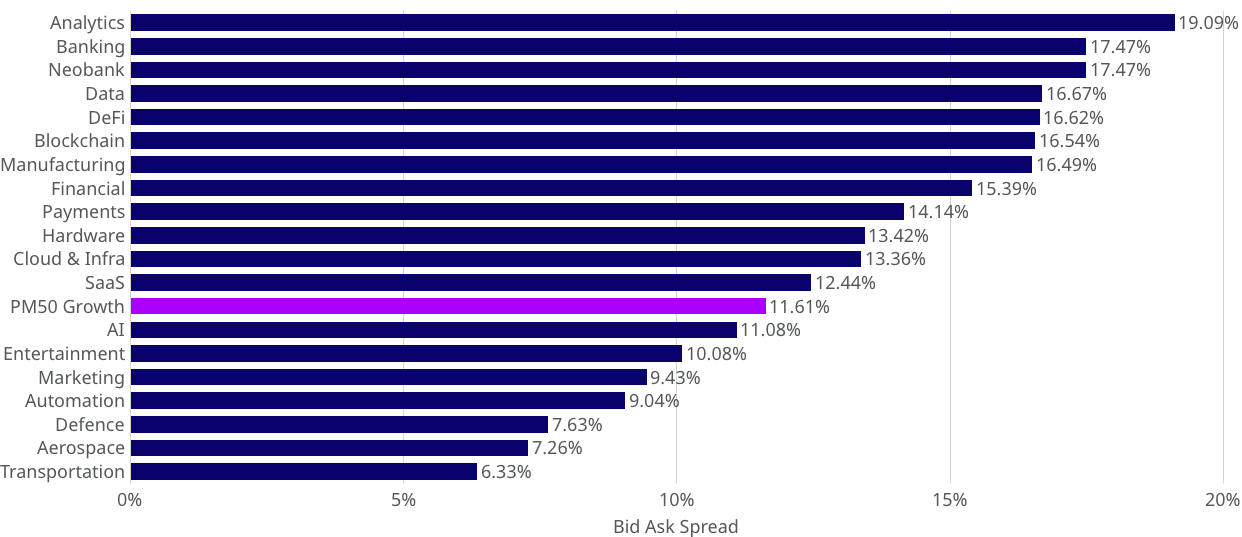
Mean Bid to Ask Spread
Sector-level Bid to Ask Spread
The chart below highlights the average bid-to-ask spread by sector for selected companies that saw notable trading activity from July 1, 2025 till July 28, 2025.
- Analytics sector recorded the widest spread at 19.09%, signaling relatively lower liquidity or greater uncertainty
- Transportation sector showed the tightest spread at 6.33%, suggesting higher confidence or more active trading
- PM50 Growth index sat in the middle with a mean spread of 11.61%
- Automation sector registered a spread of 9.04%, pointing to relatively balanced trading conditions and moderate confidence
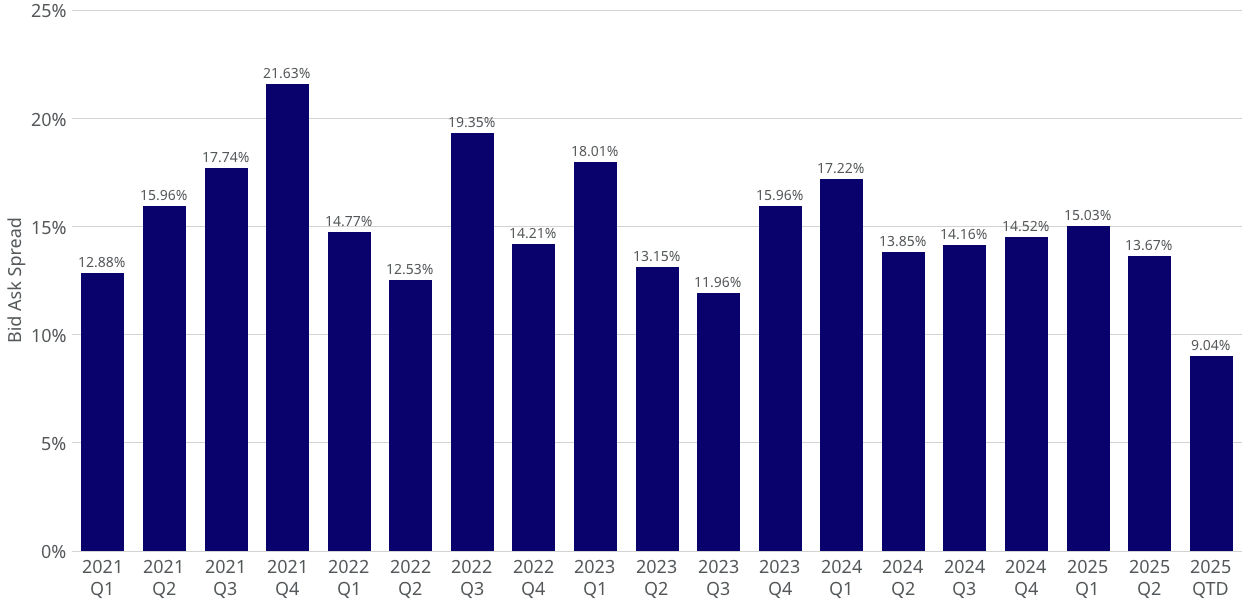
Automation Sector's Quarterly Mean Bid to Ask Spread
The chart below tracks the quarterly average bid-to-ask spread for the Automation sector.
- Q4 2024 marked the peak, with spreads averaging 21.63%, indicating elevated market friction or uncertainty at the time
- Current QTD shows the lowest spread at 9.04%, though the aggregate is based on a limited number of data points given the early stage of the quarter
- During Q2 2025, the spread settled at 13.67%, pointing to improved market stability and tighter pricing
Private Market: Company Level within Automation Sector
|| Company-level analysis as of July 28, 2025.
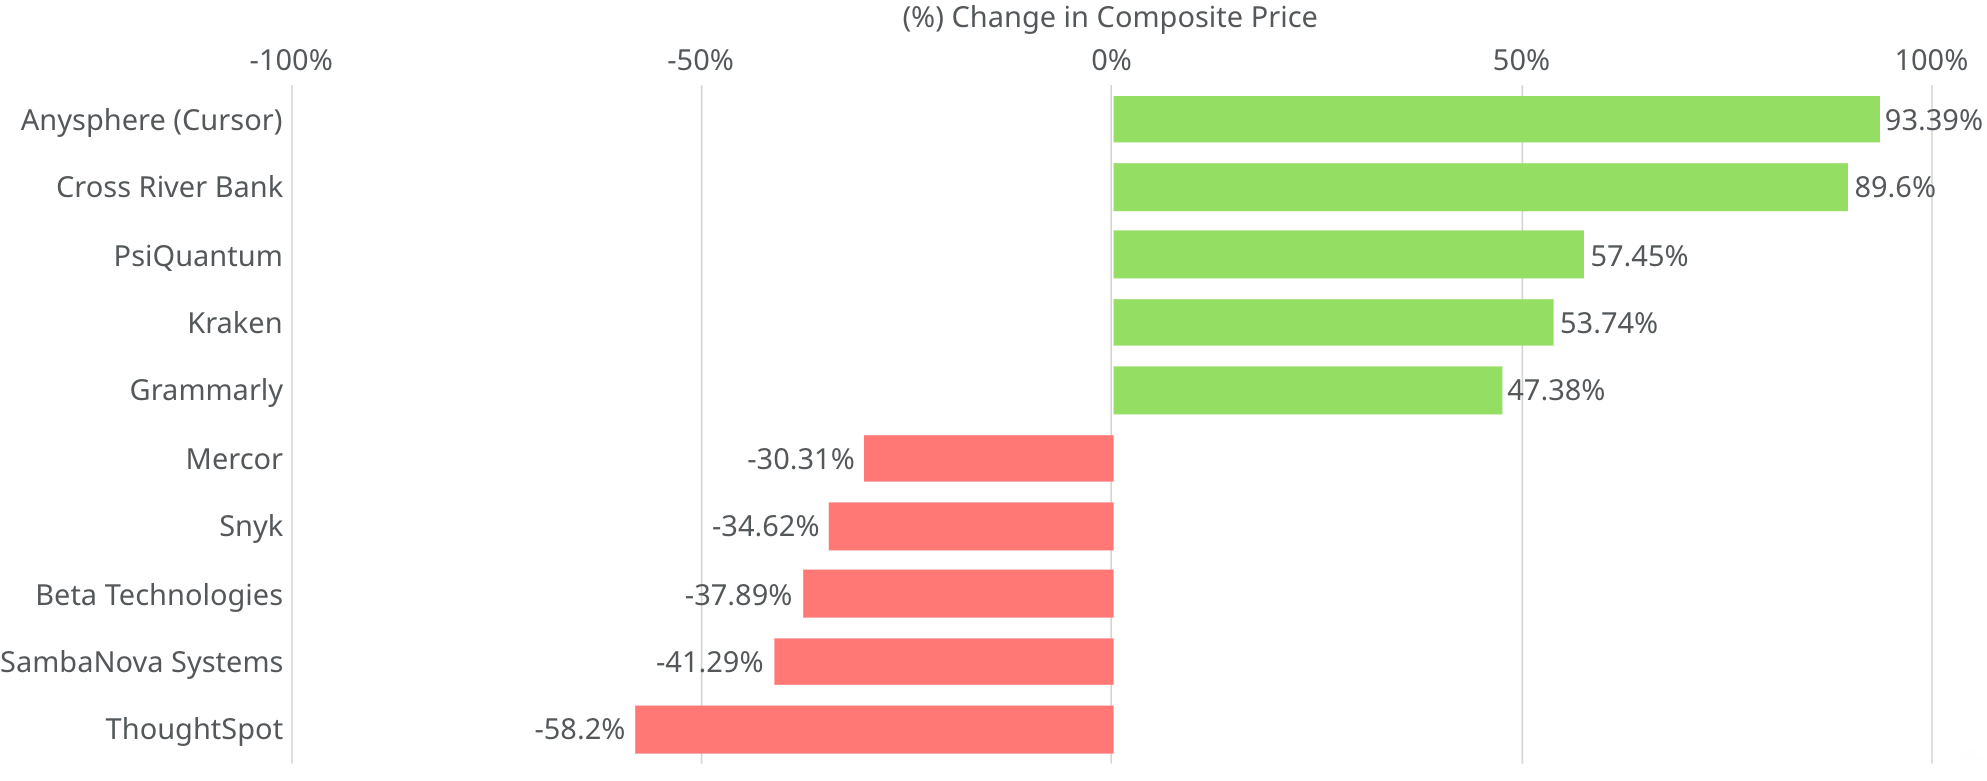
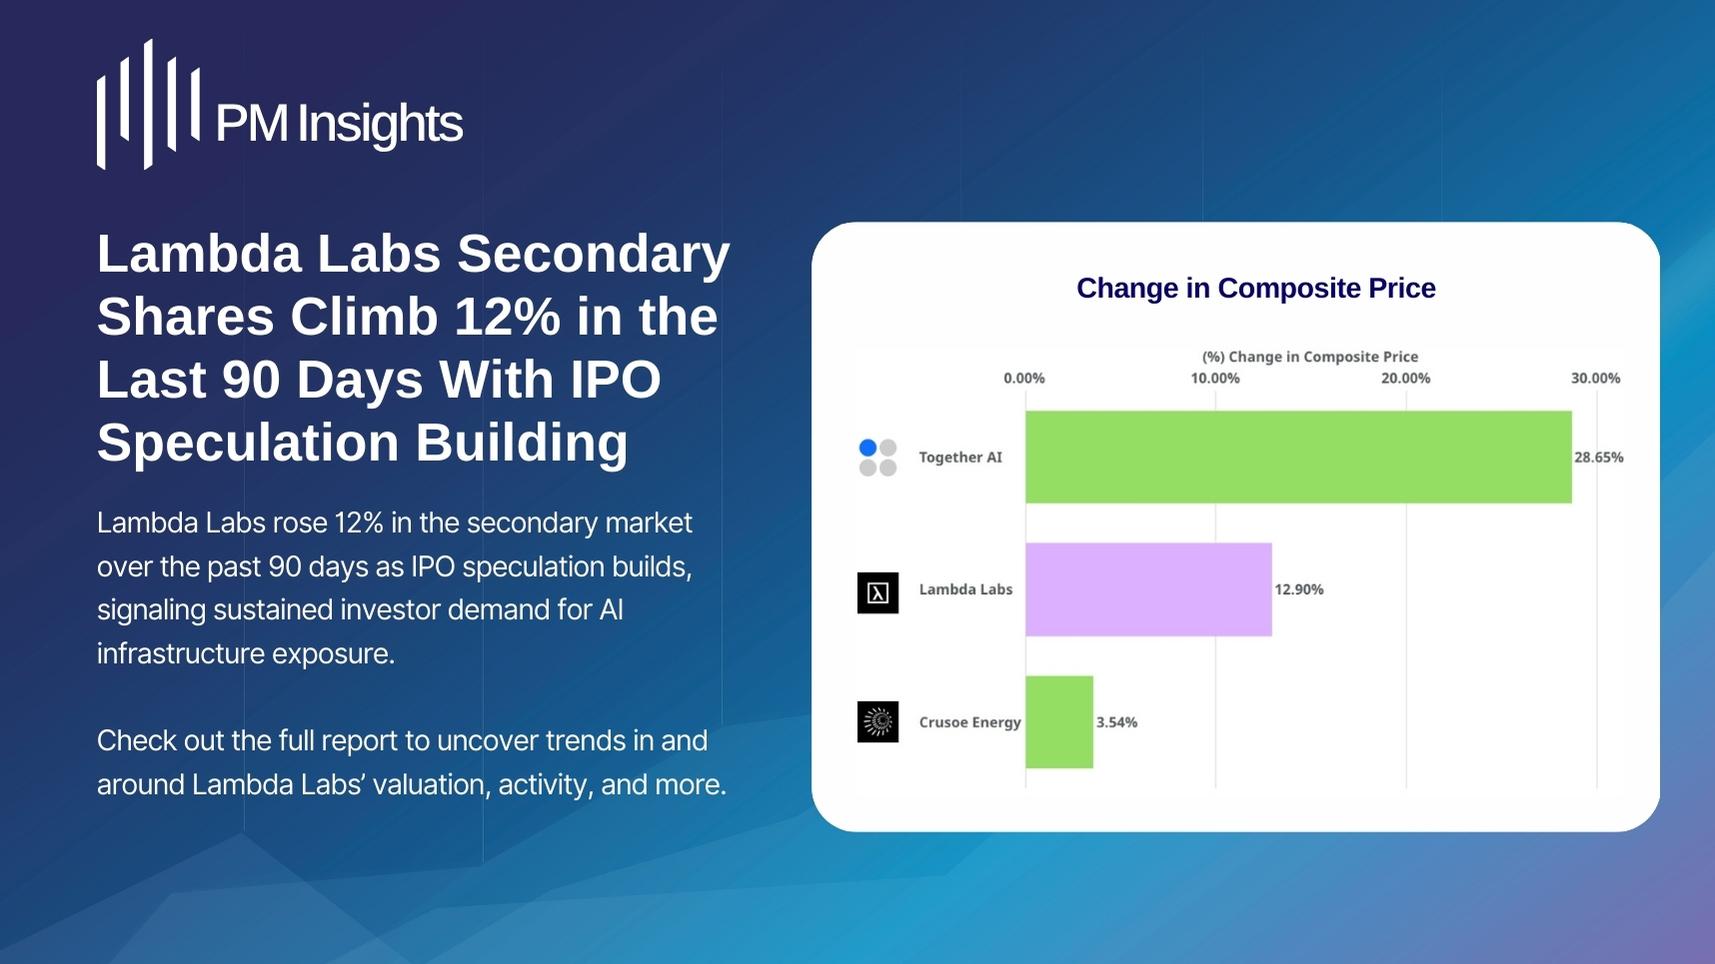
Change in Composite Price
PM Insights highlights the top five and bottom five companies in terms of change in composite price between April 30, 2025 and June 28, 2025 with significant activities i.e. at least 3 institutional-level contributions—to identify those experiencing the most notable shifts in market sentiment.
- Anysphere (Cursor) surged with a remarkable 93.39% gain in composite price from $248.24 to $480.07
- ThoughtSpot faced the sharpest decline, with its composite price falling 58.2% from $12.11 to $5.06
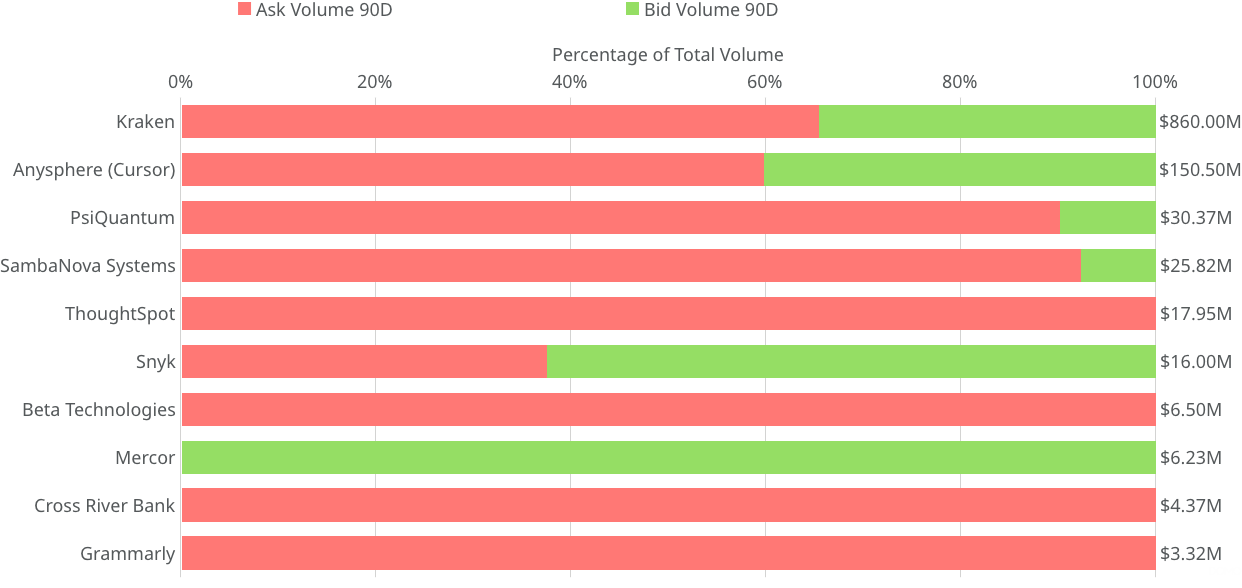
90D Bid and Ask Volume Ratio
PM Insights highlights the top five and bottom five companies with significant activities in terms of change in total bid and ask volume between April 30, 2025 and June 28, 2025.
- Mercor saw exclusively bid-driven trading with a total volume of $6.23M, reflecting strong buying pressure
- ThoughtSpot ($17.95M), Cross River Bank ($4.37M), and Grammarly ($3.32M) recorded fully ask-driven volume, signaling pronounced selling pressure as investors actively offloaded shares
Most Active Names Performance Across All Sectors
Data as of June 28, 2025.
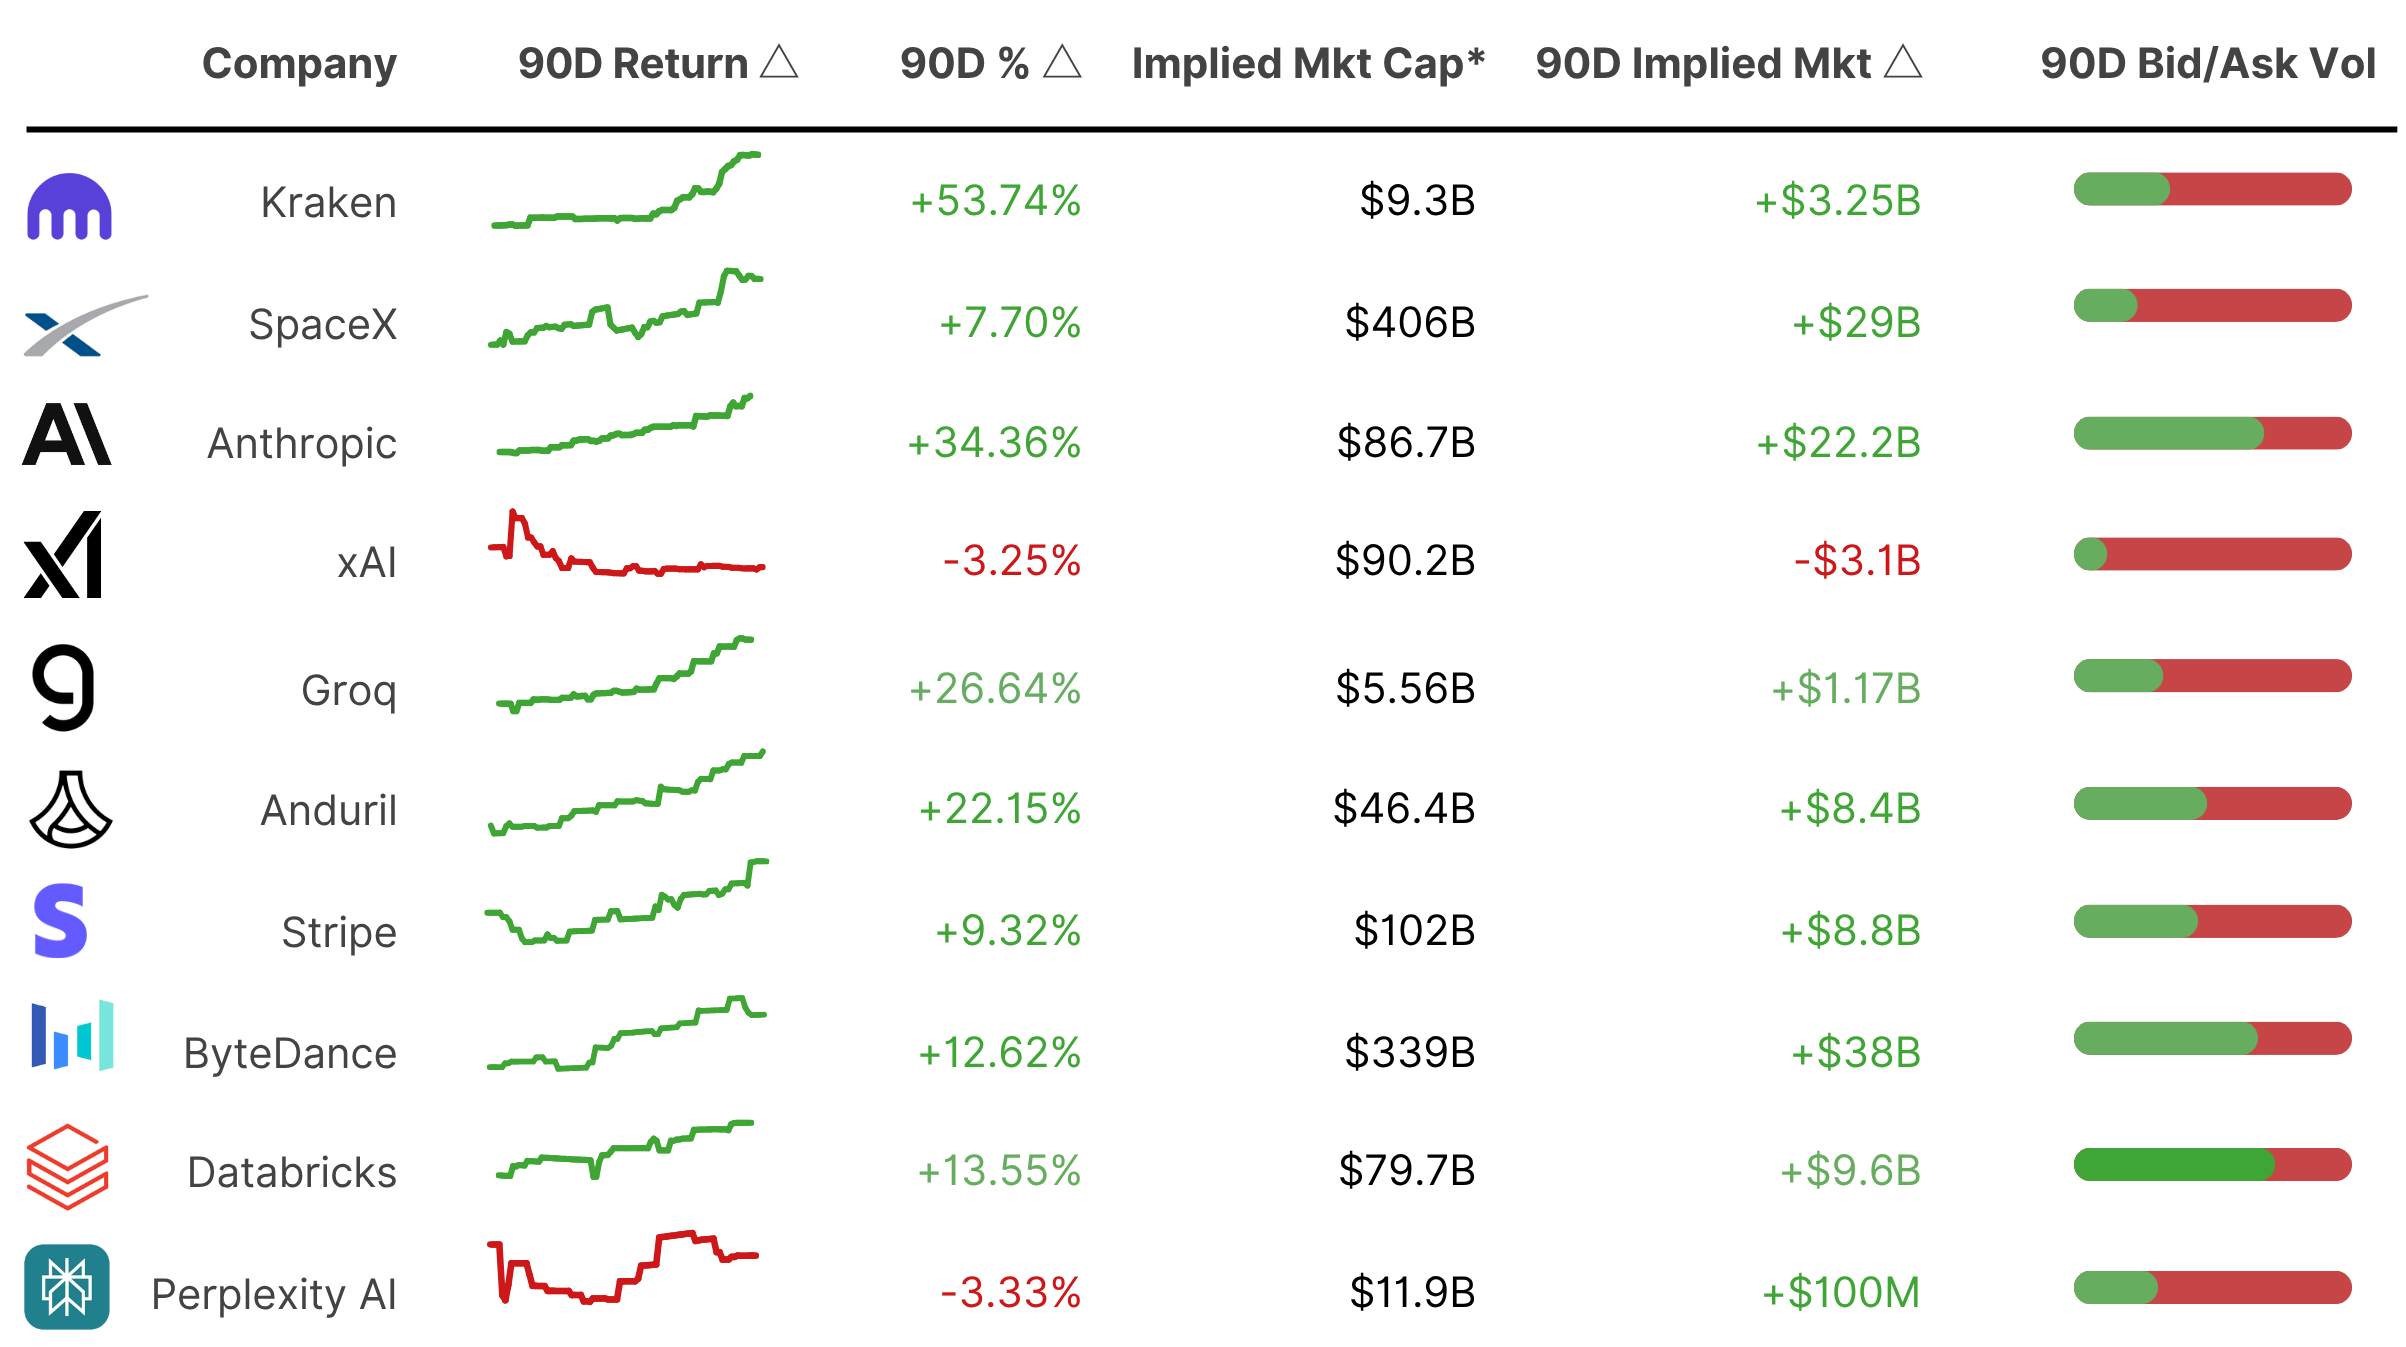
* Price (USD) estimated based on secondary market activity observed by PM Insights. Valuation is estimated based on said price and share count from state filings and/or news in the public domain. Note that share count in calculations may change as new filing documents are obtained.
.jpg)
.jpg)
.jpg)
.jpg)
.jpg)
.jpg)
.jpg)
.jpg)
Ready to see it in action?
Schedule a demo with one of our experts
